Computing Students rewarded with Exclusive Google visit following Project Success
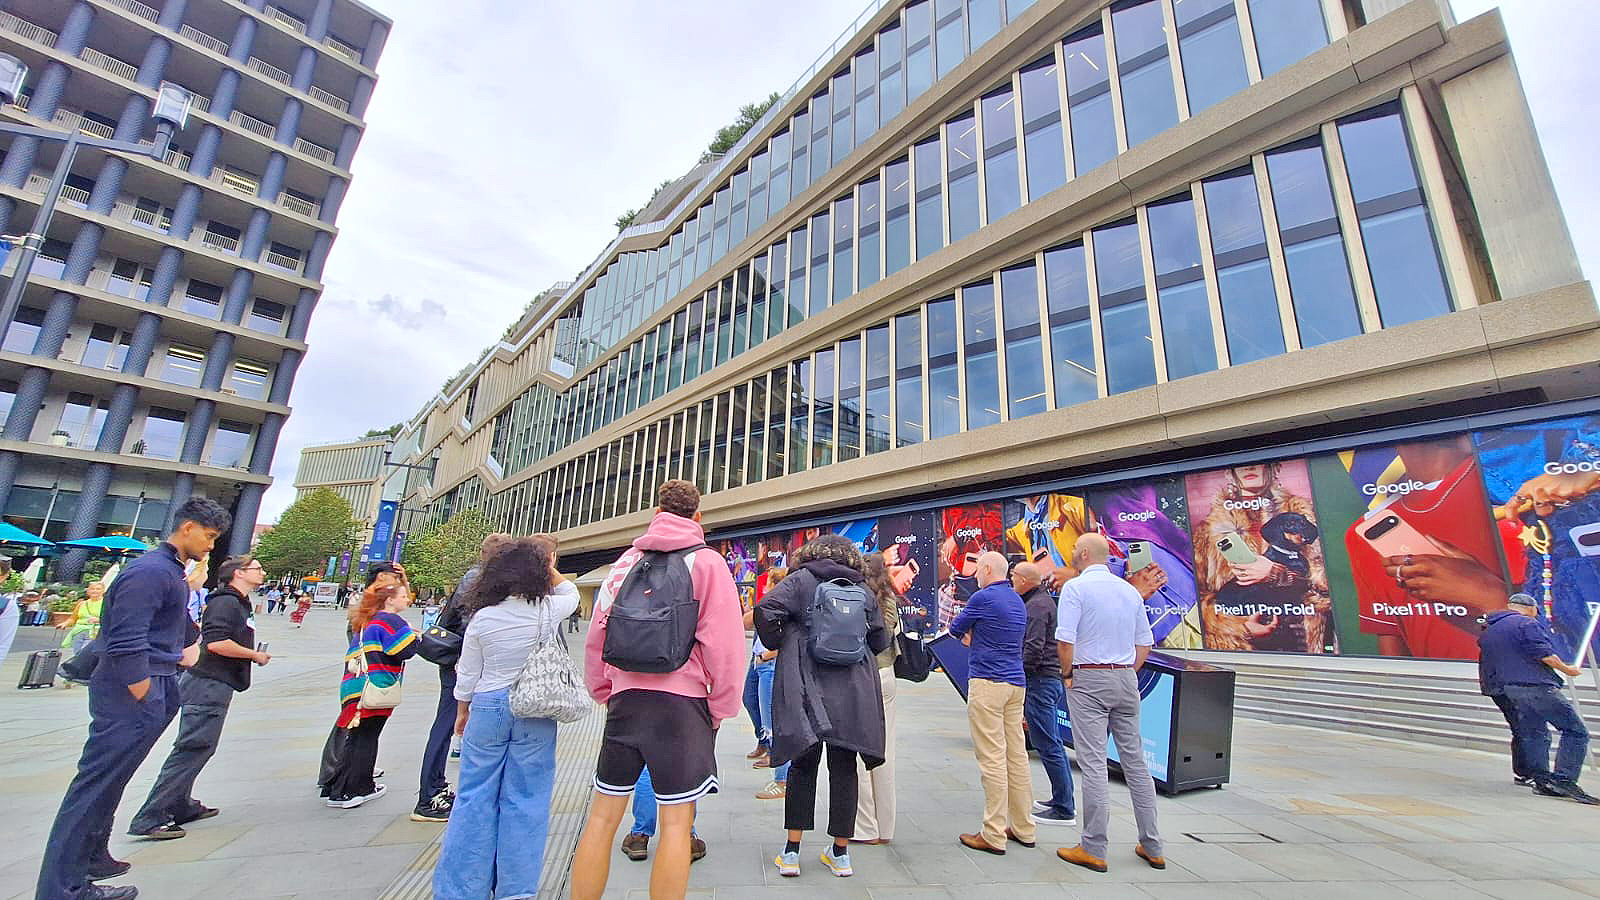
The University of Wales Trinity Saint David (UWTSD) School of Applied Computing recently celebrated the excellent achievements of its Computing students by rewarding competition winners and the best final year students with an exclusive educational visit to Google’s London headquarters at King’s Cross.
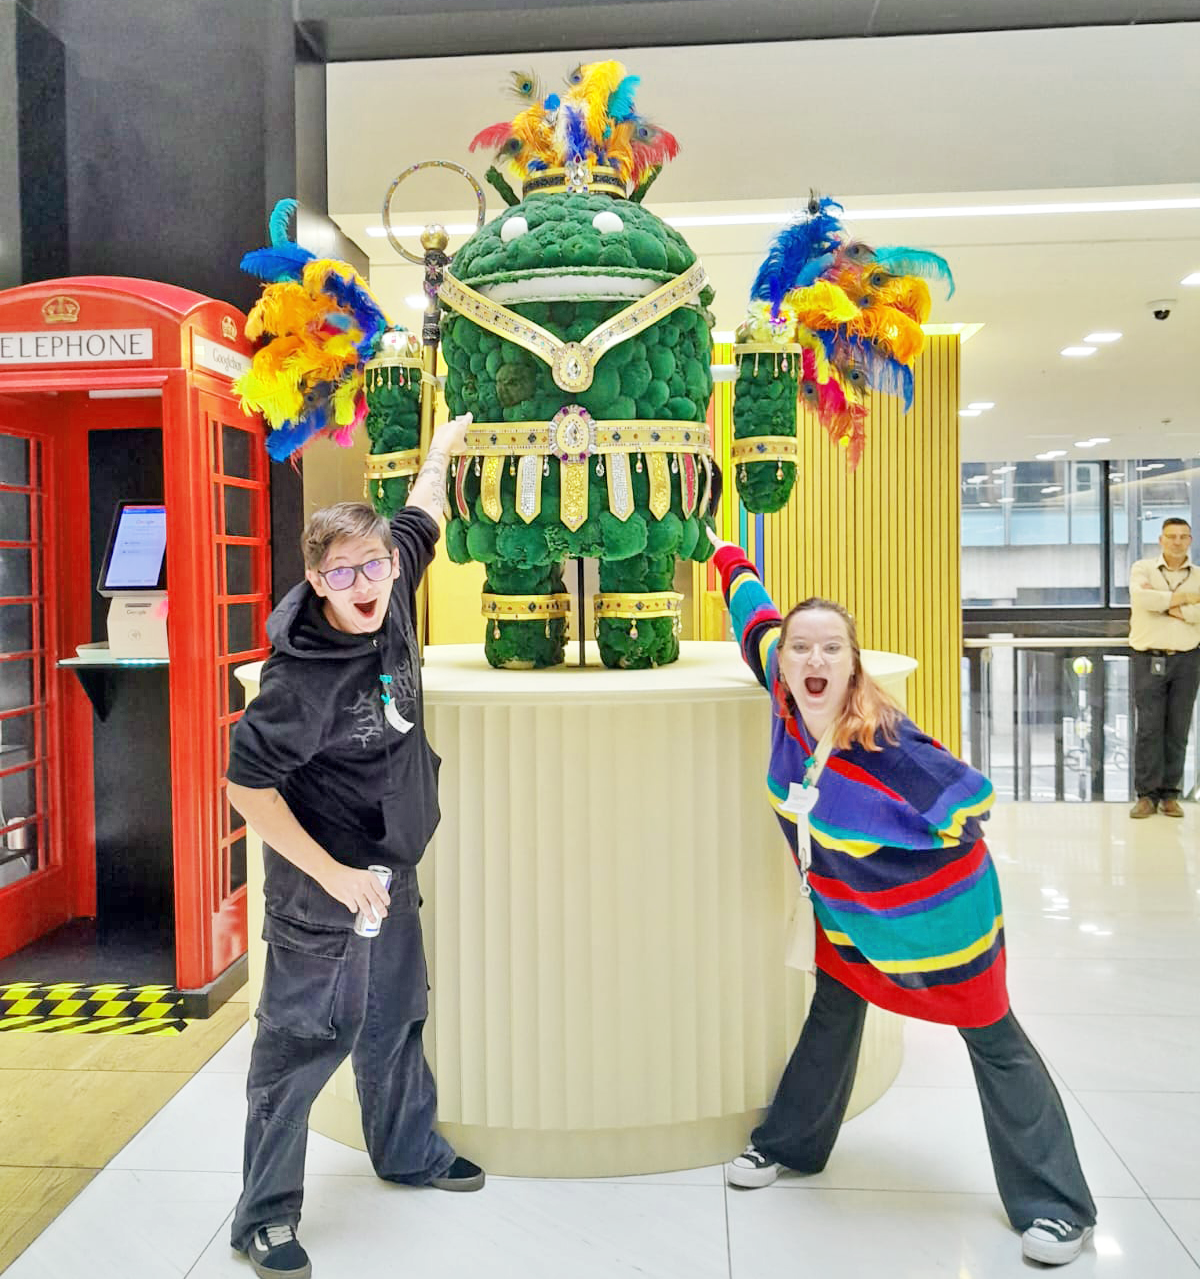
The trip was organised by UWTSD Computing Lecturer James Williams, in collaboration with Dafydd Moore (Chief Information Officer at Superdry) and Leah Shergold (Google Account Executive). The visit recognised students who had demonstrated outstanding innovation, creativity and academic excellence during their course.
Fourteen students were invited to attend, including winners of the Year 2 Changemakers Innovation Competition, Year 3 Emerging Trends Competition, and recipients of Best and Award-Winning Final Year Projects.
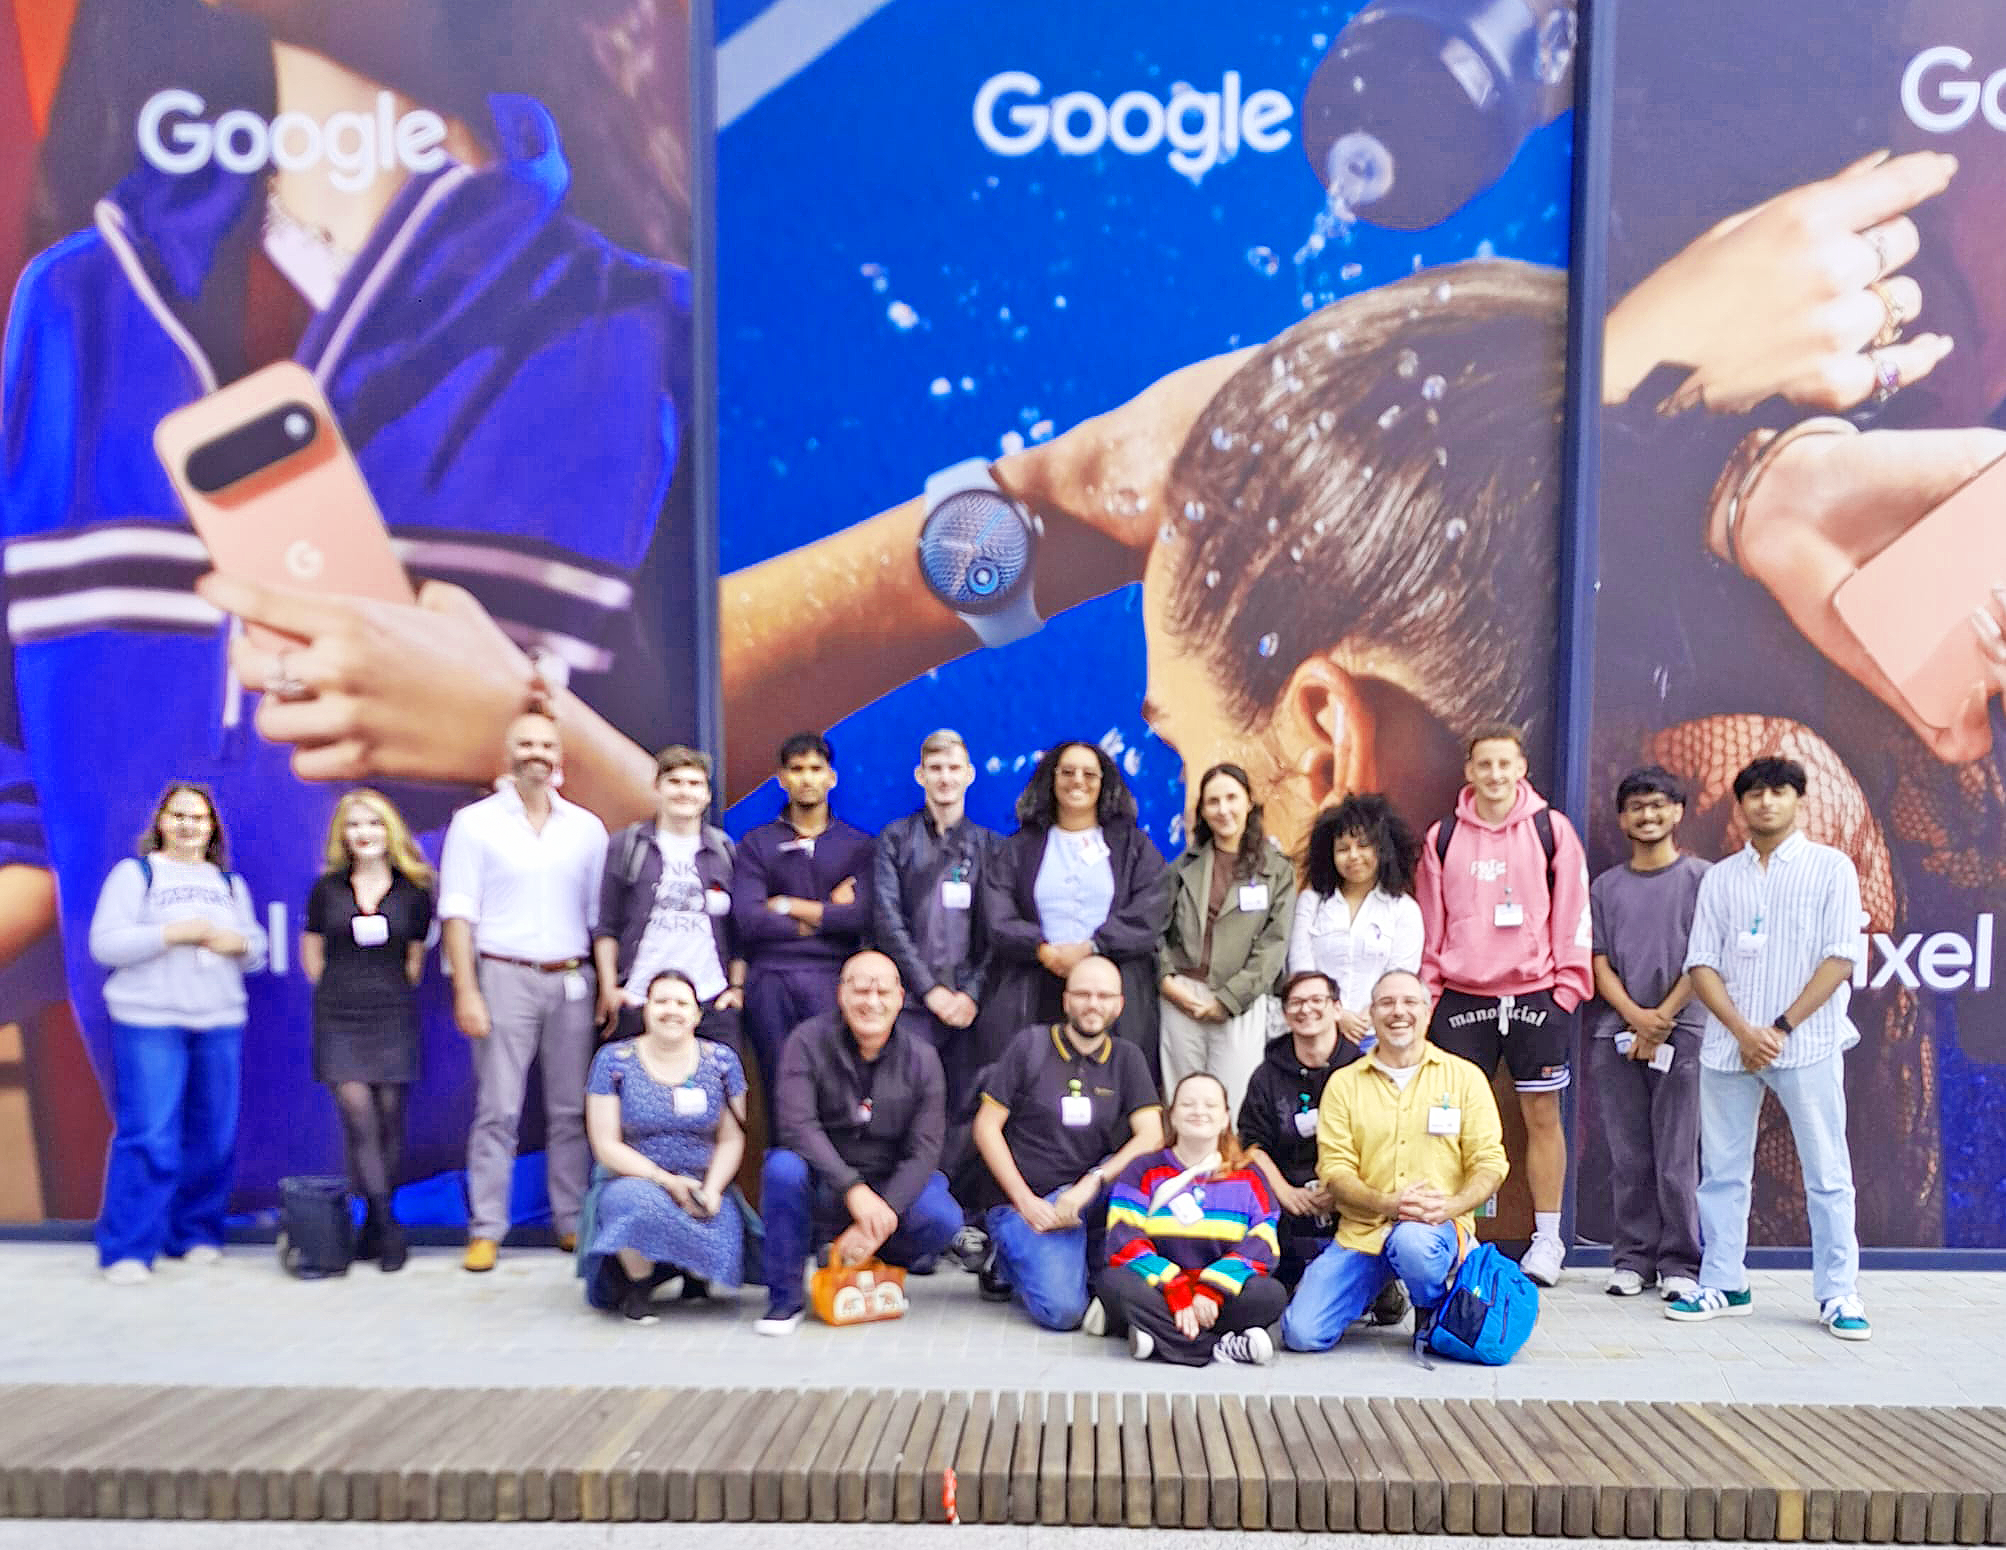
| SOAC SUPERSTARS: 🌟Tonio George, 🌟Olivia Collins, 🌟Kieran Brown, 🌟Max Beasley, 🌟Ashanti Mighten, 🌟Jonathan Frise, 🌟Serena Jonathan, 🌟Max Jones, 🌟Sohaan Sureshkumar, 🌟Rehan Joseph, 🌟Tia Willock, 🌟Molly Thomas, 🌟Edward Lloyd, 🌟 Daniel Leone |
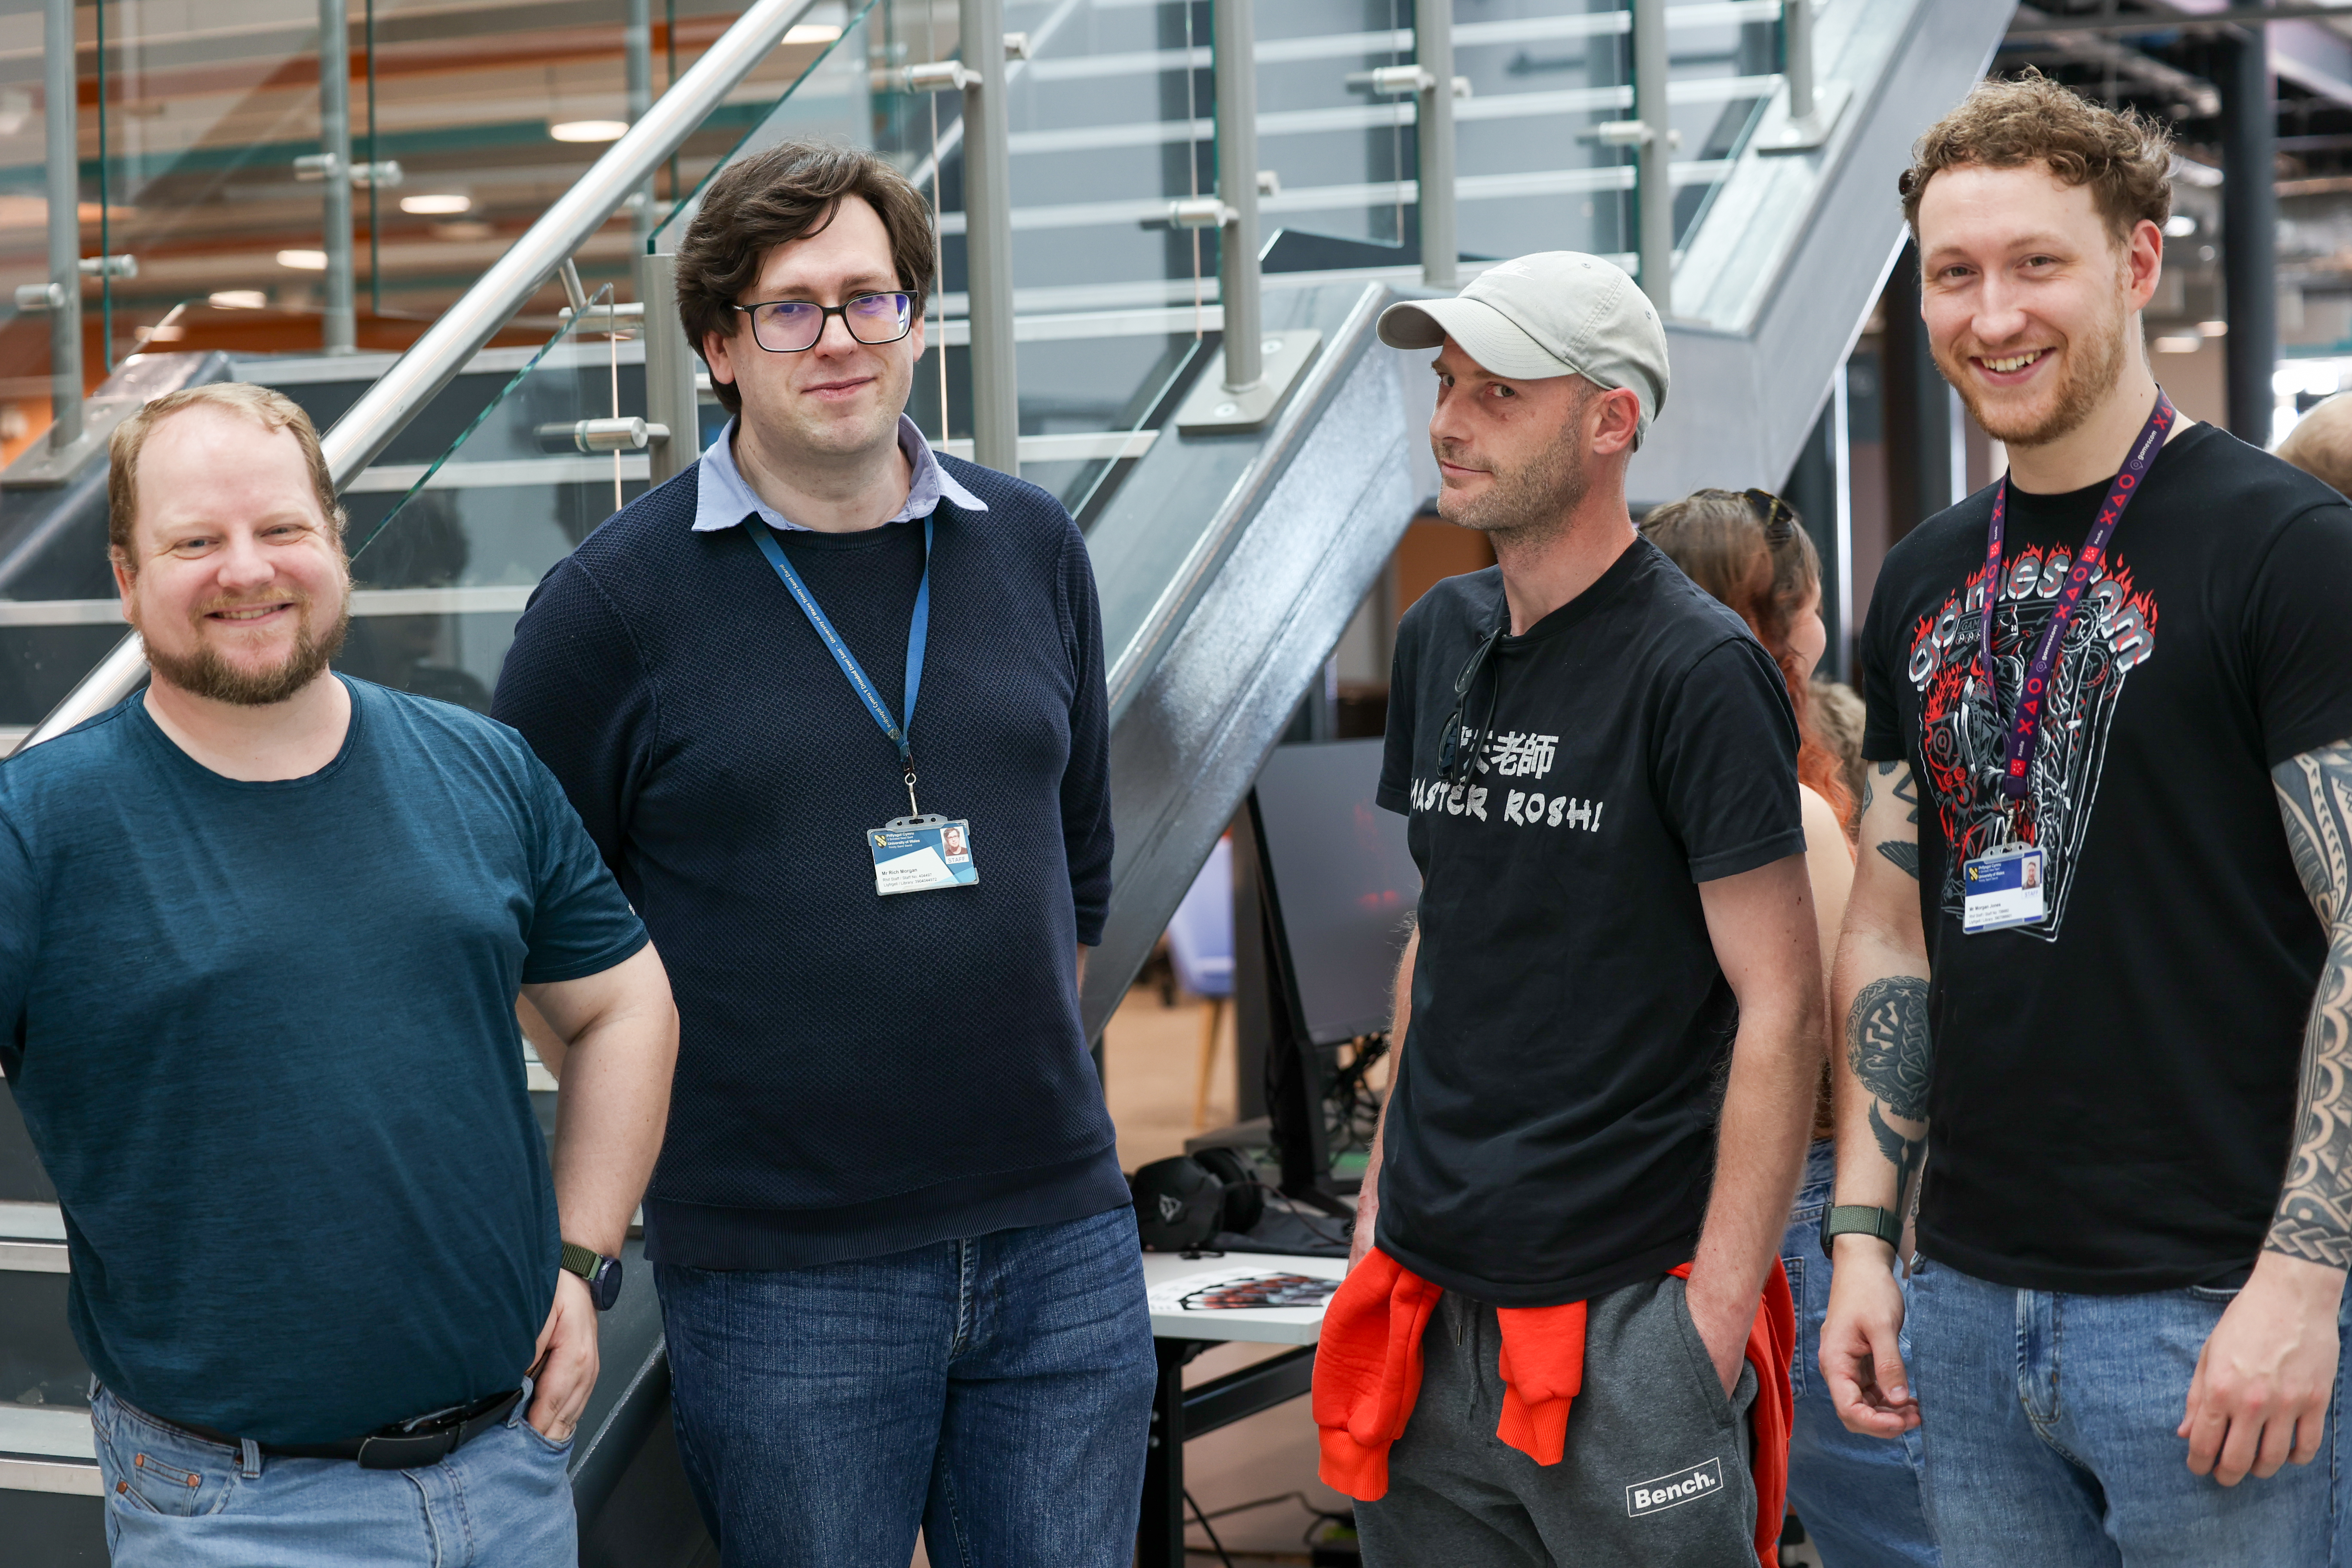
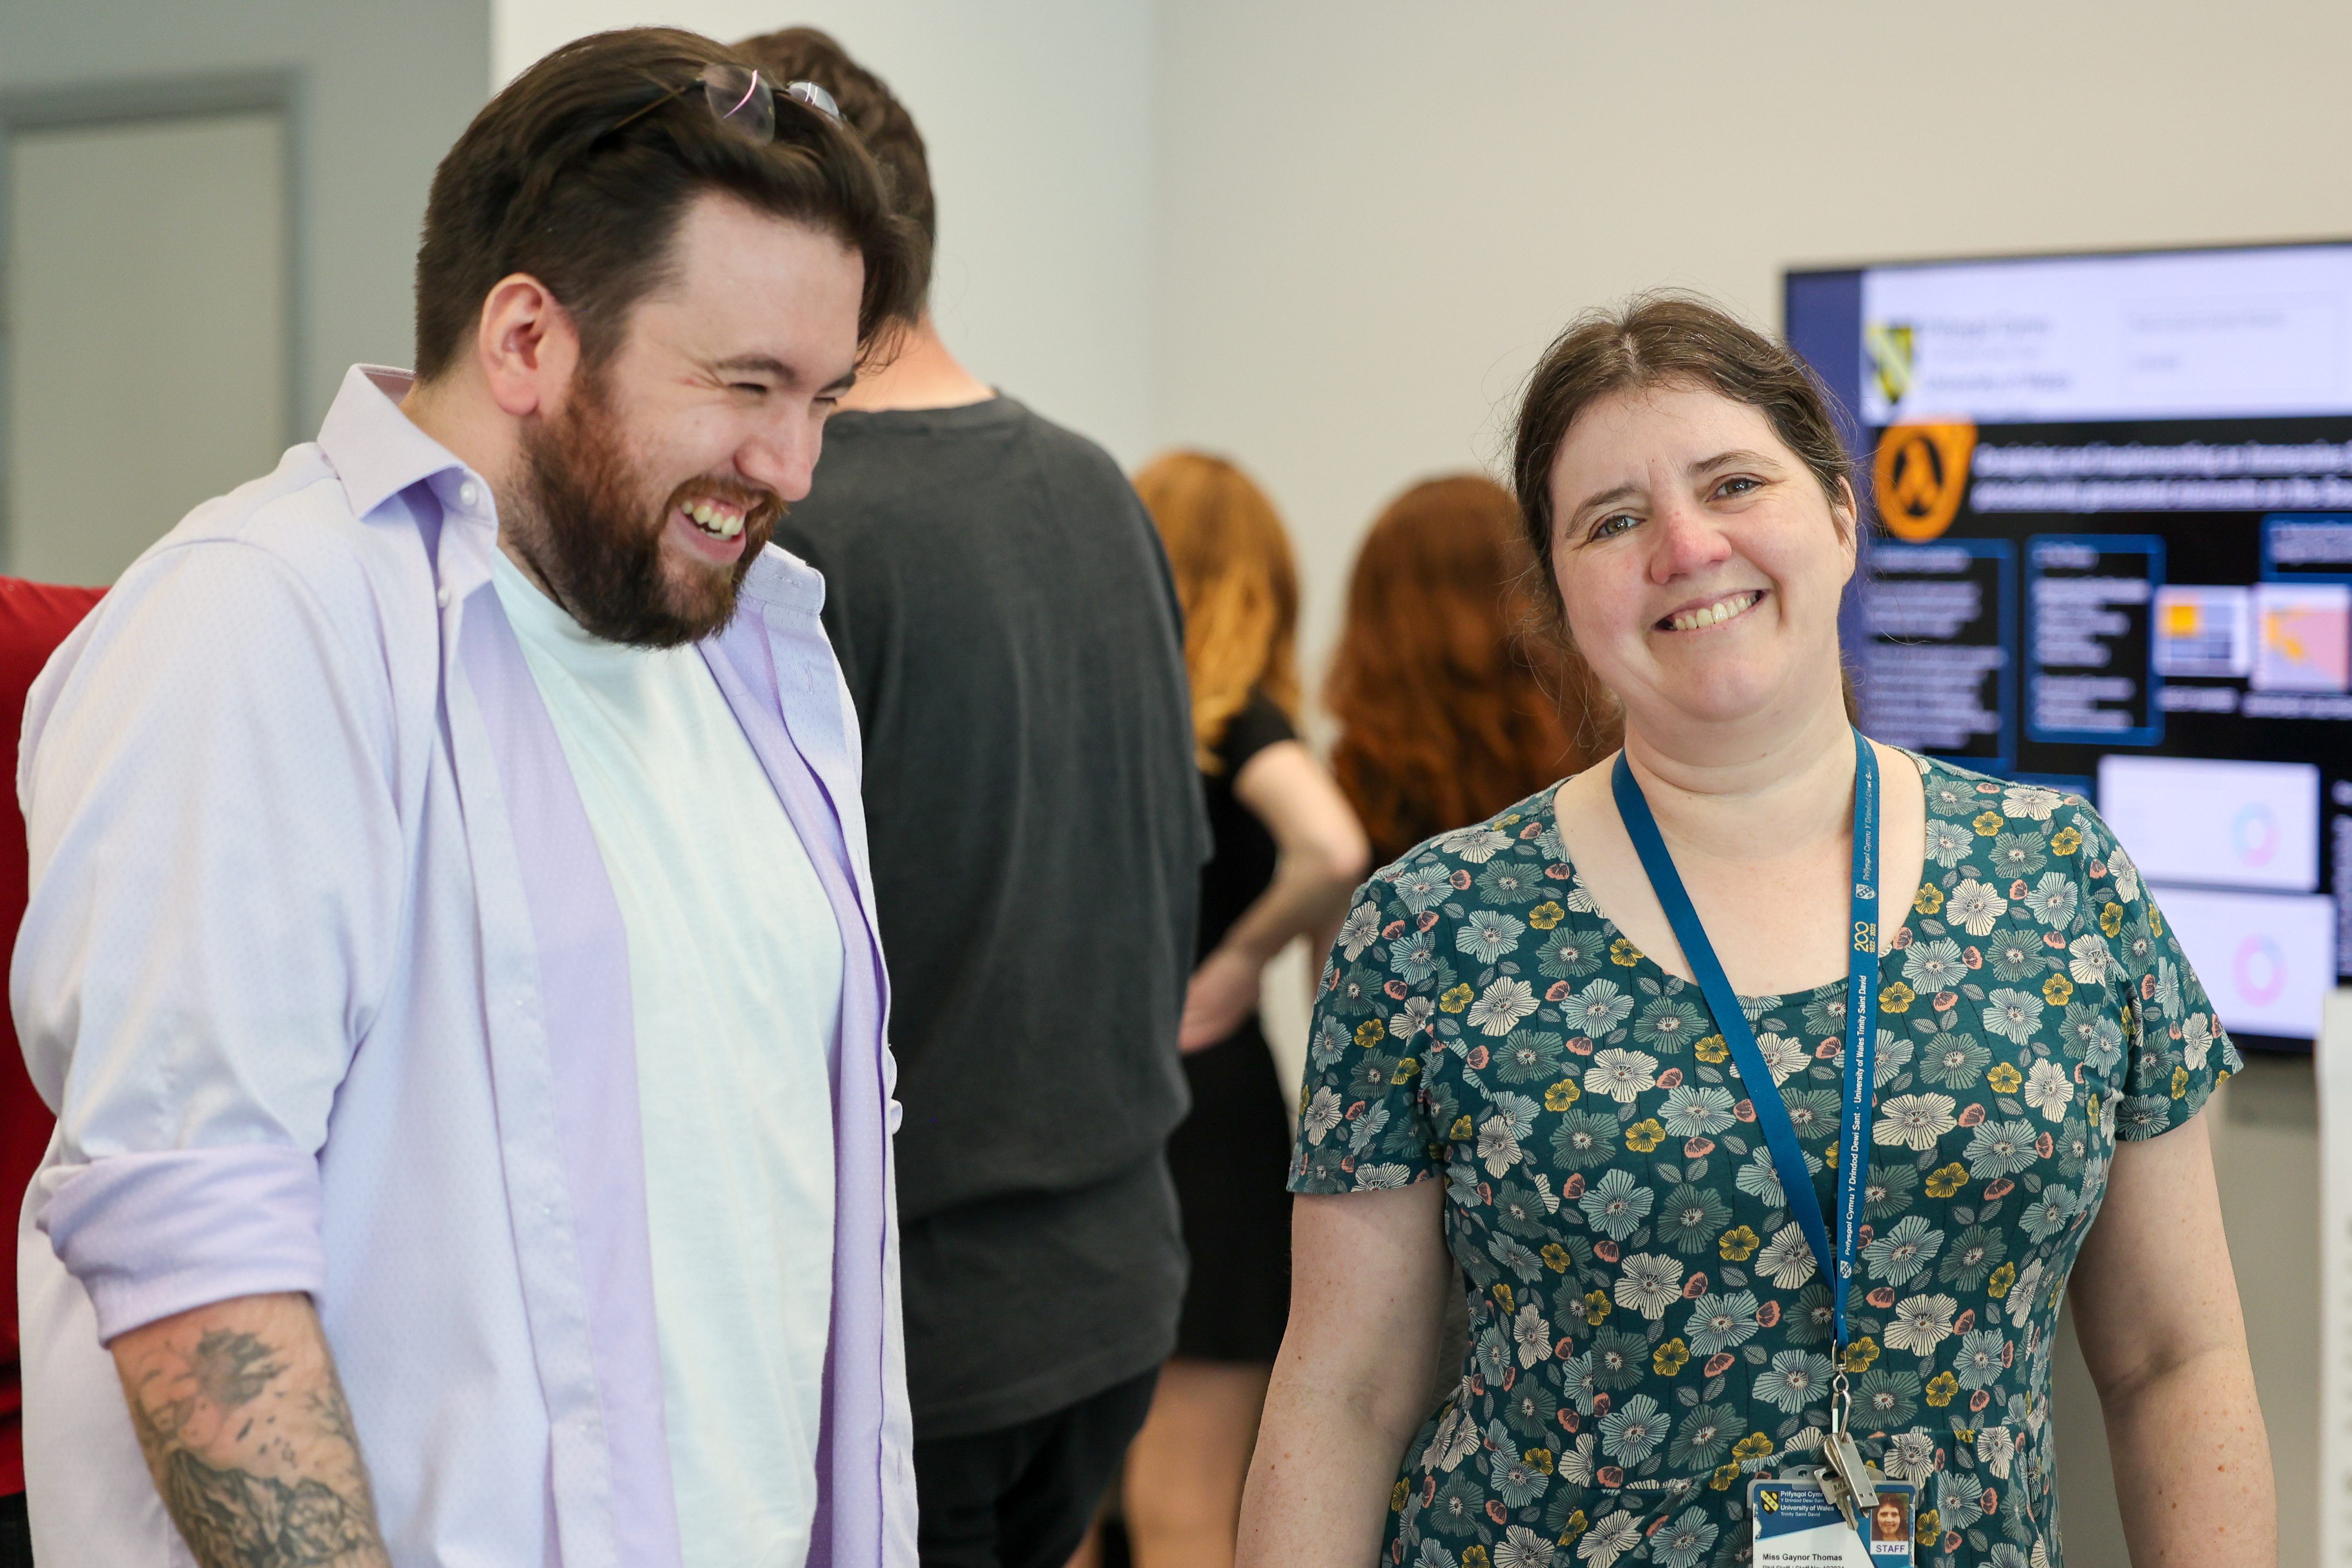
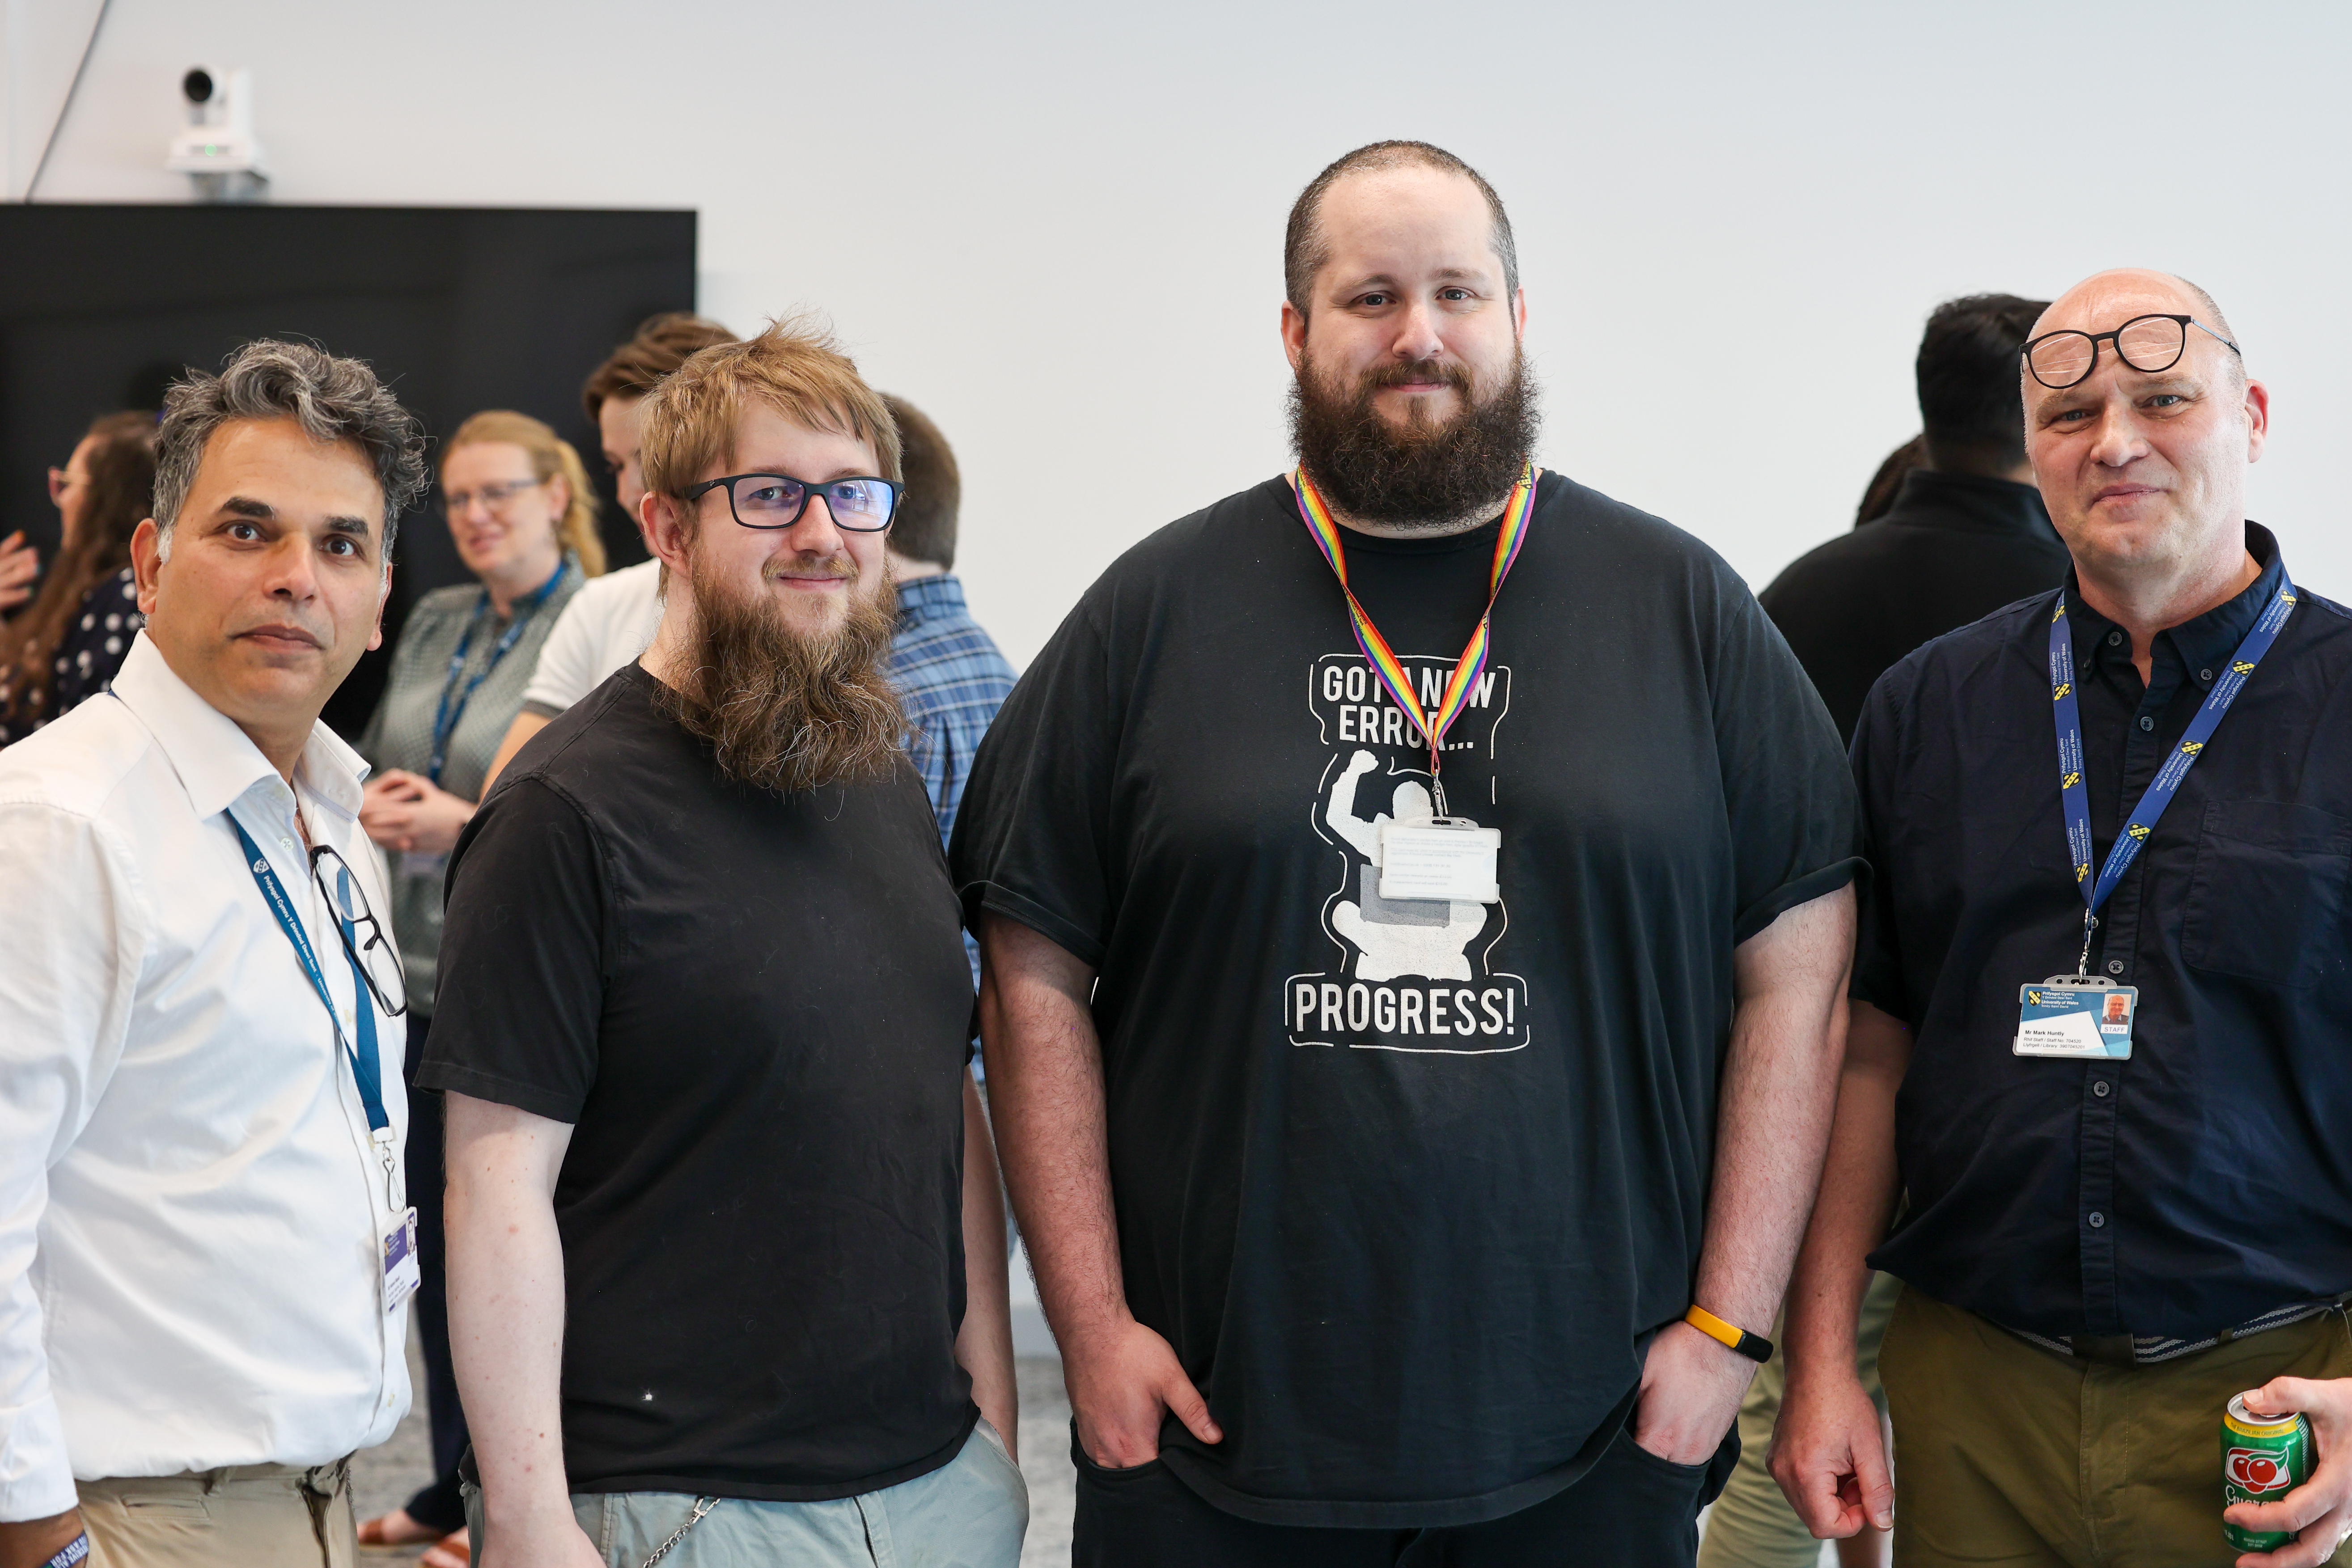
Accompanying the students were UWTSD Computing lecturers James Williams, Ewa Kazimierska, Gaynor Thomas and Mark Huntly.
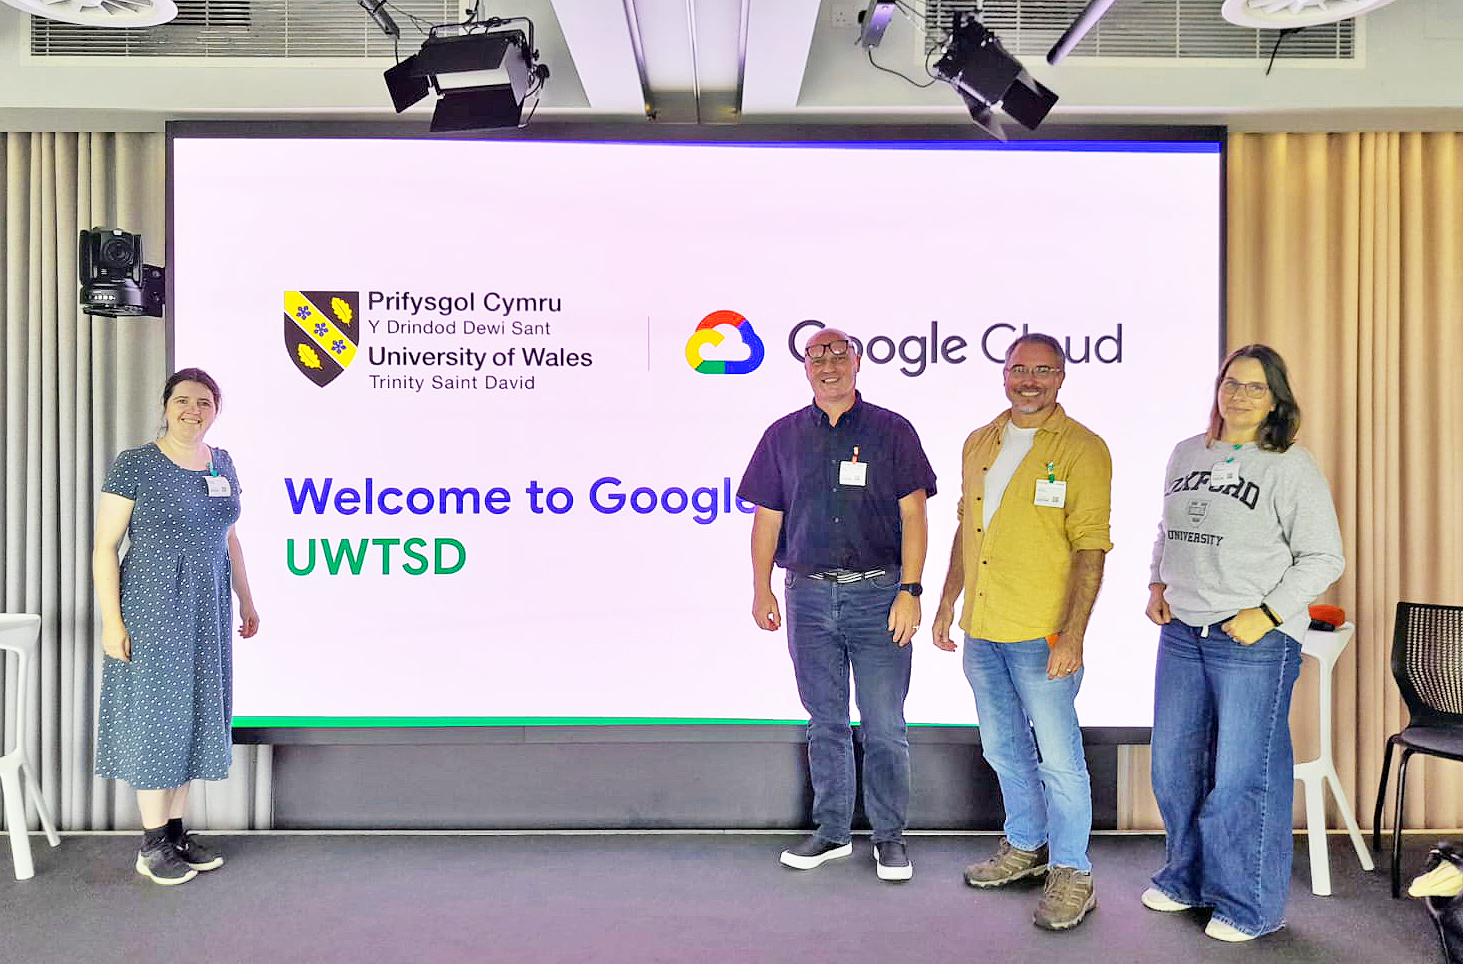
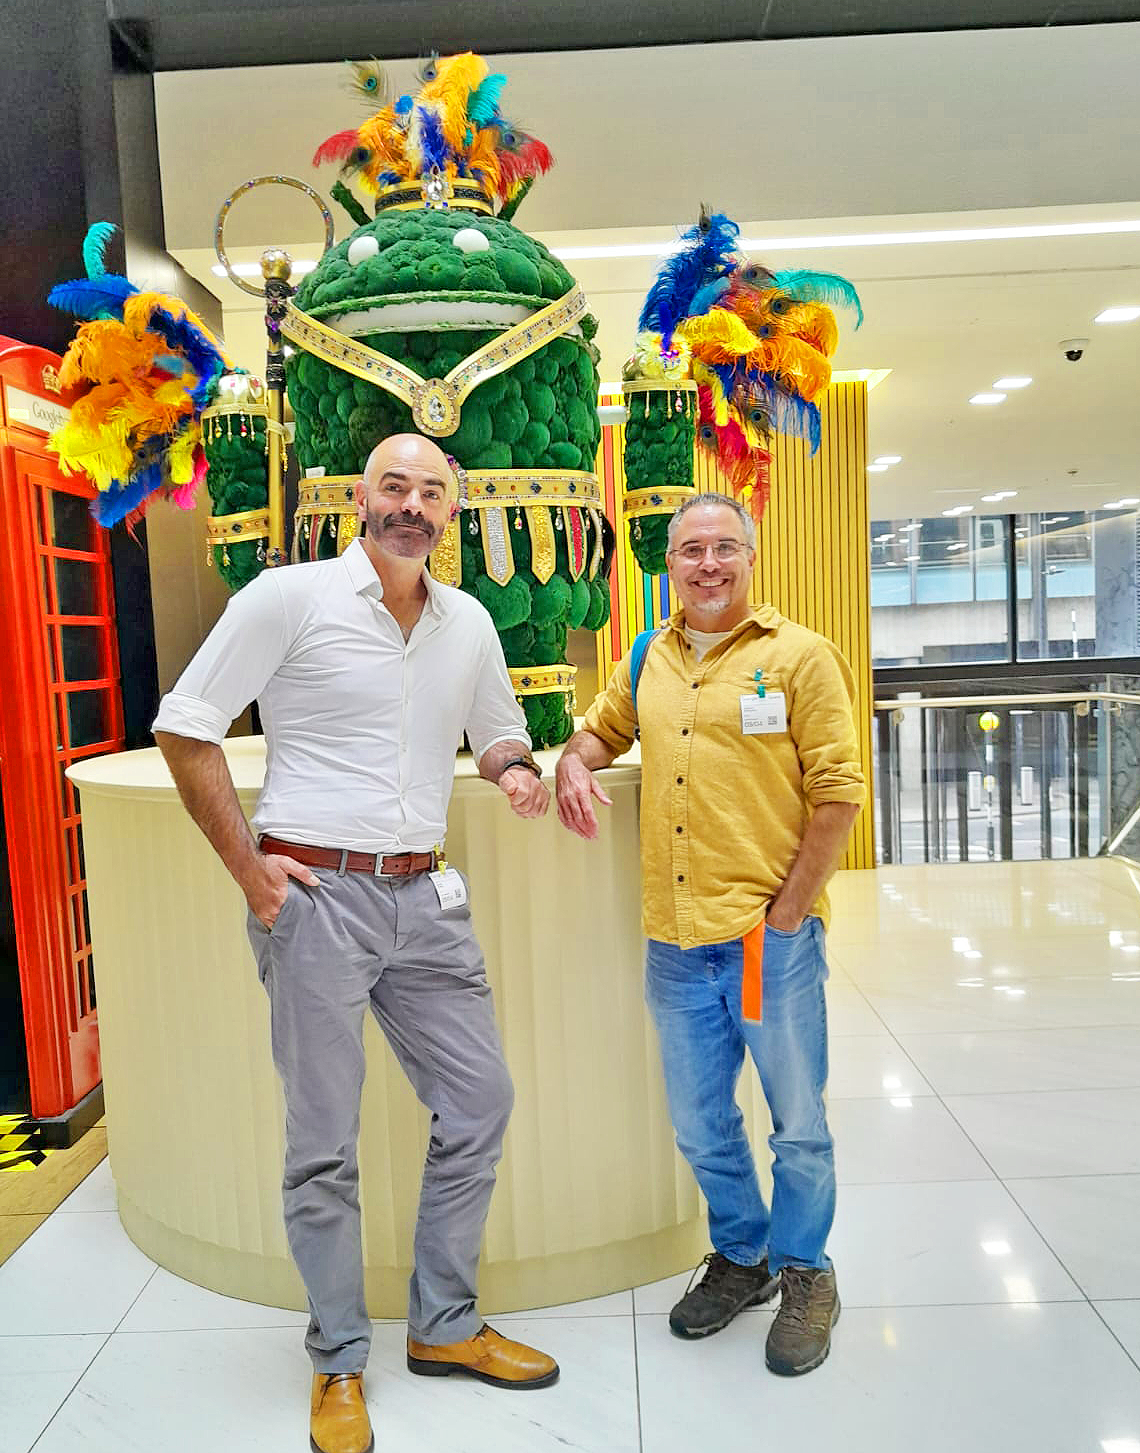
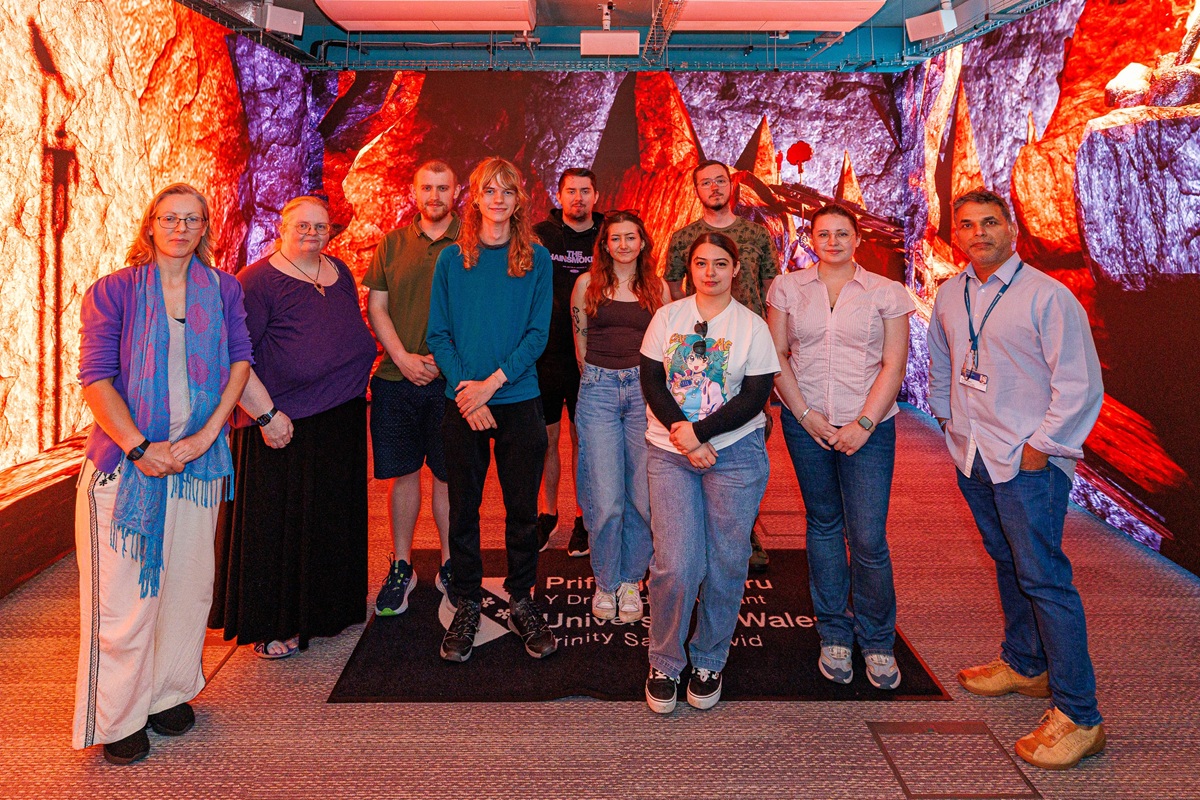
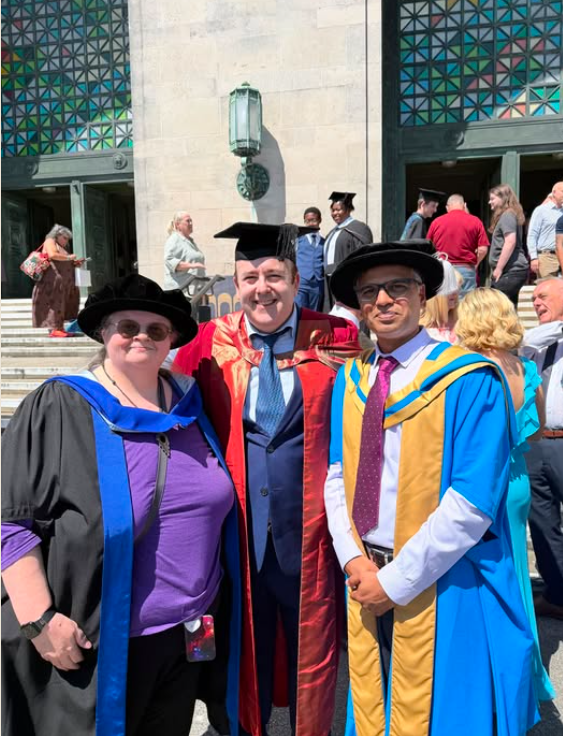
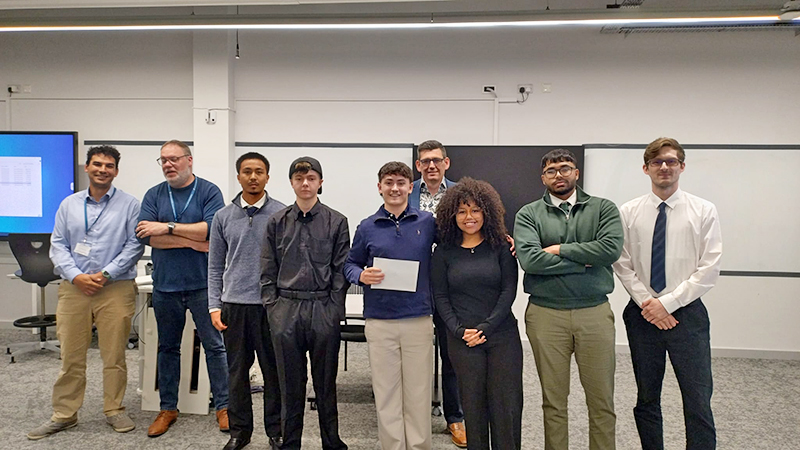
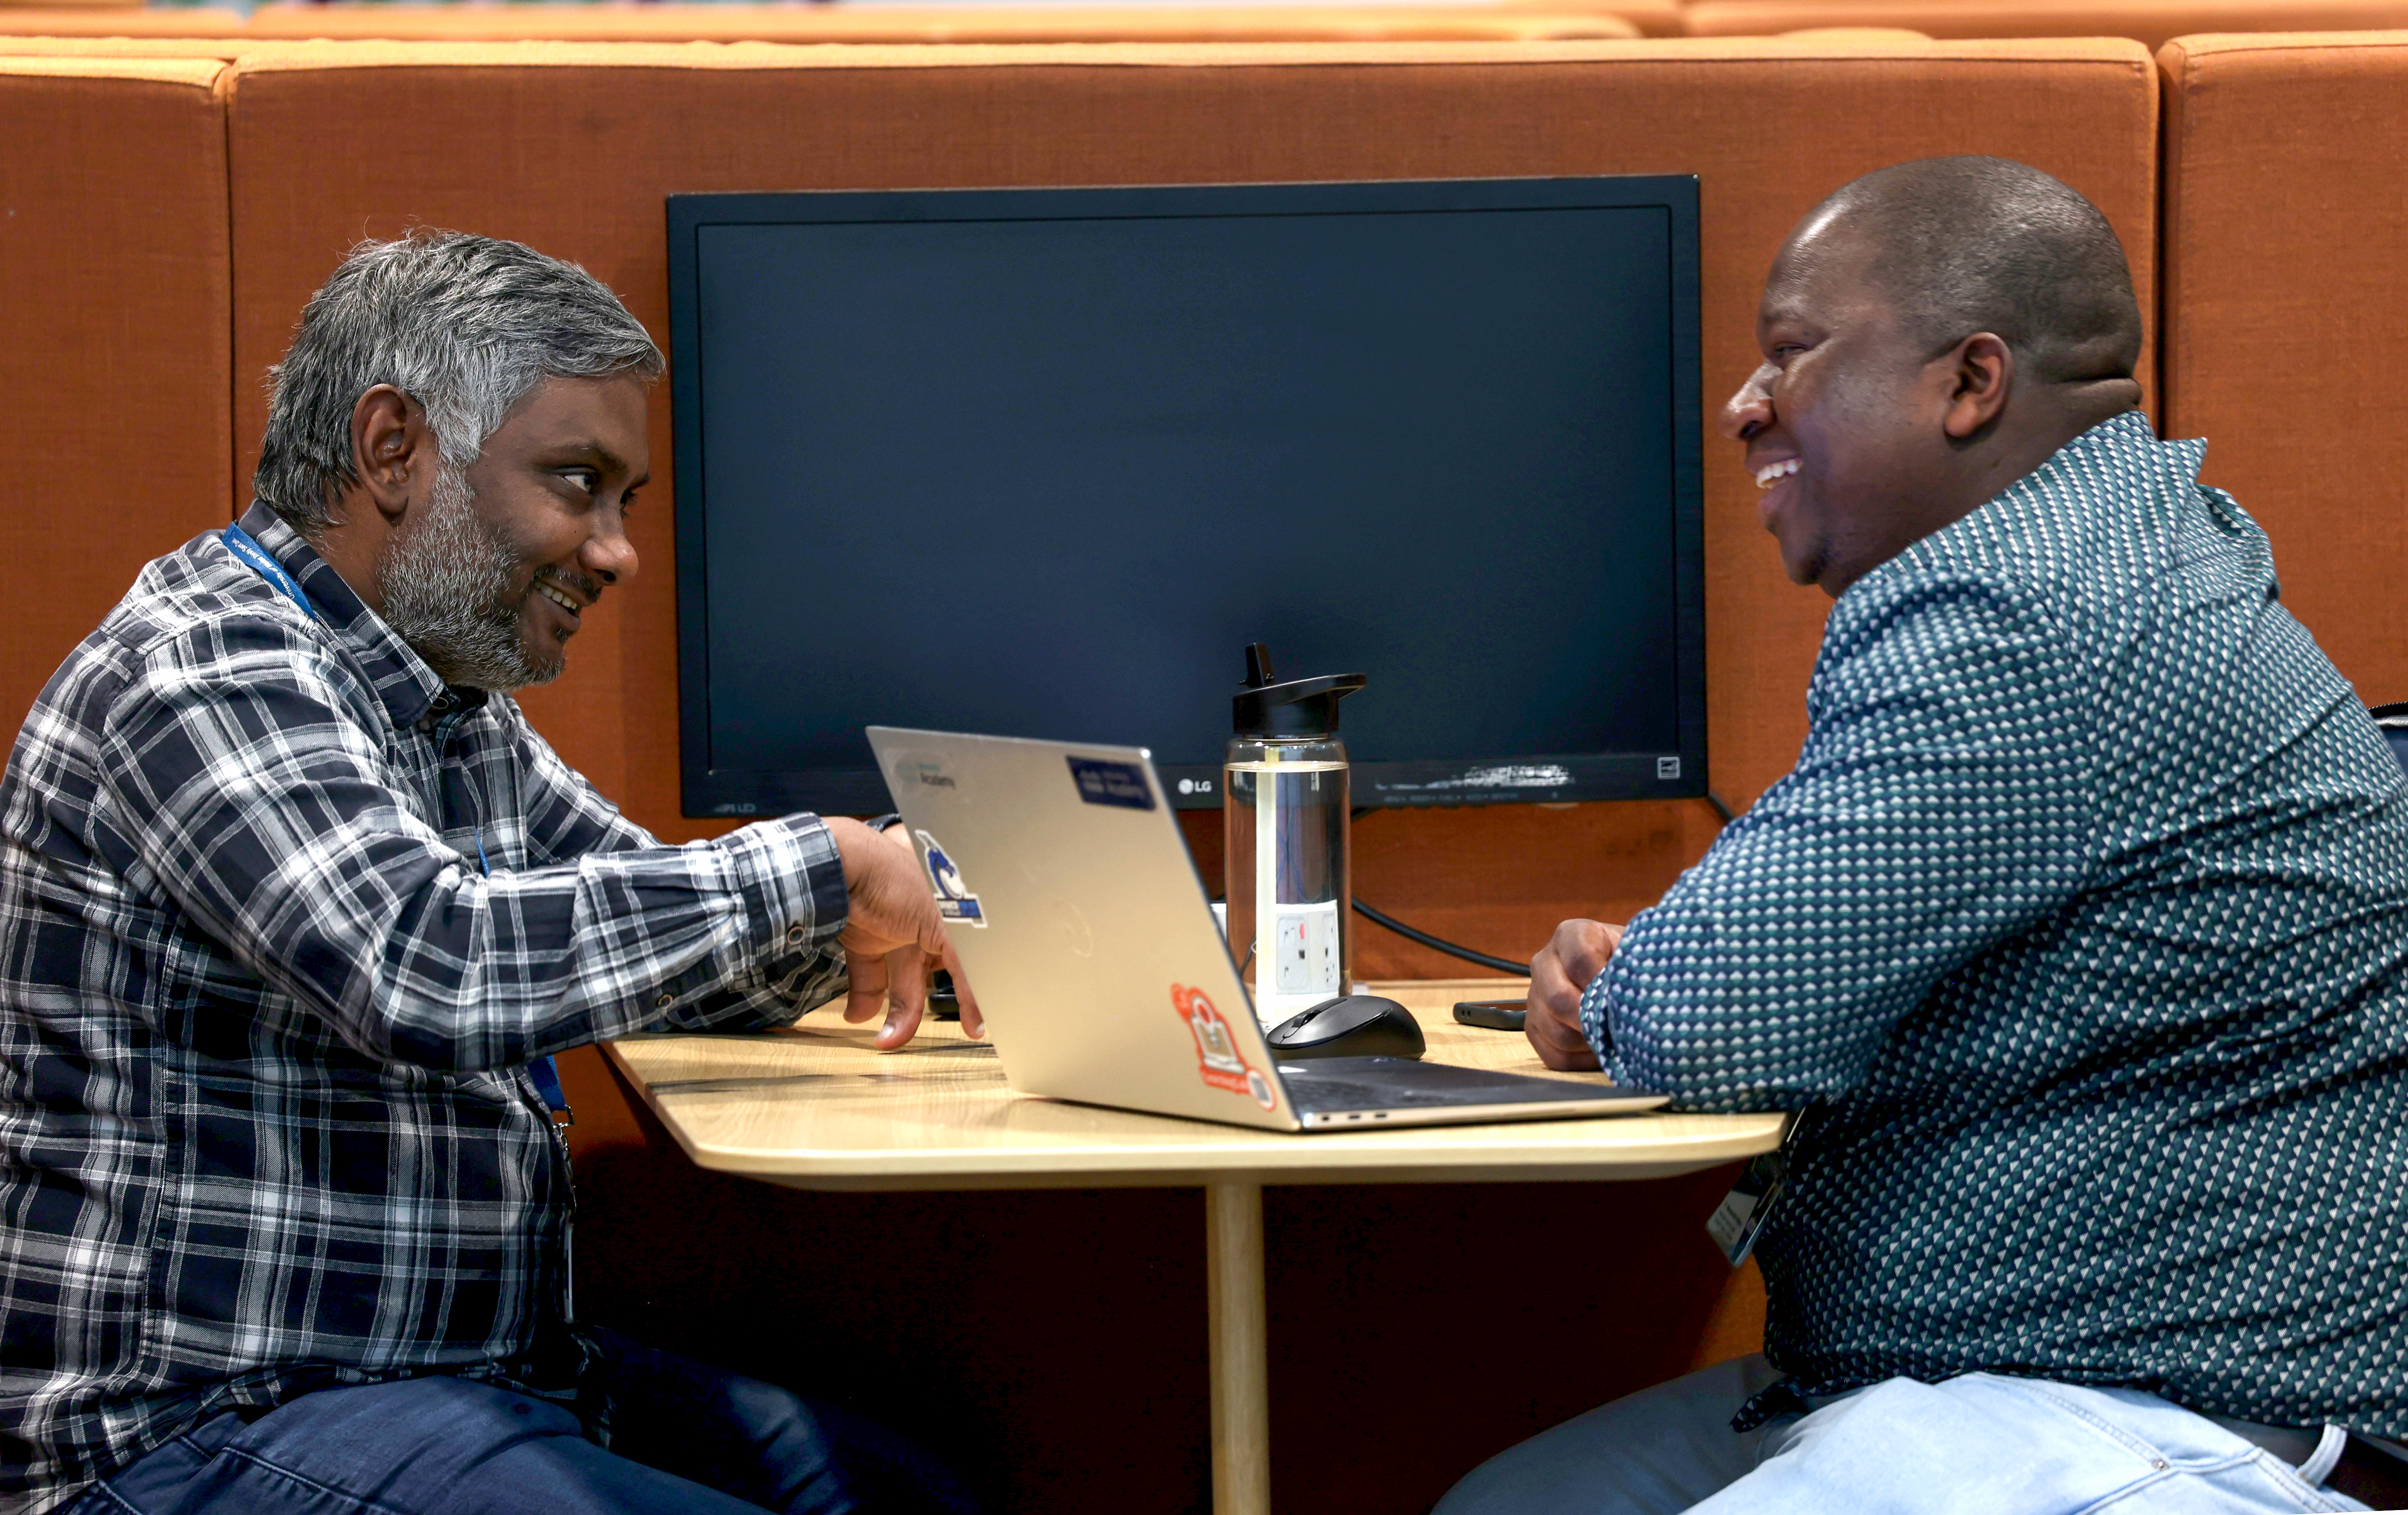
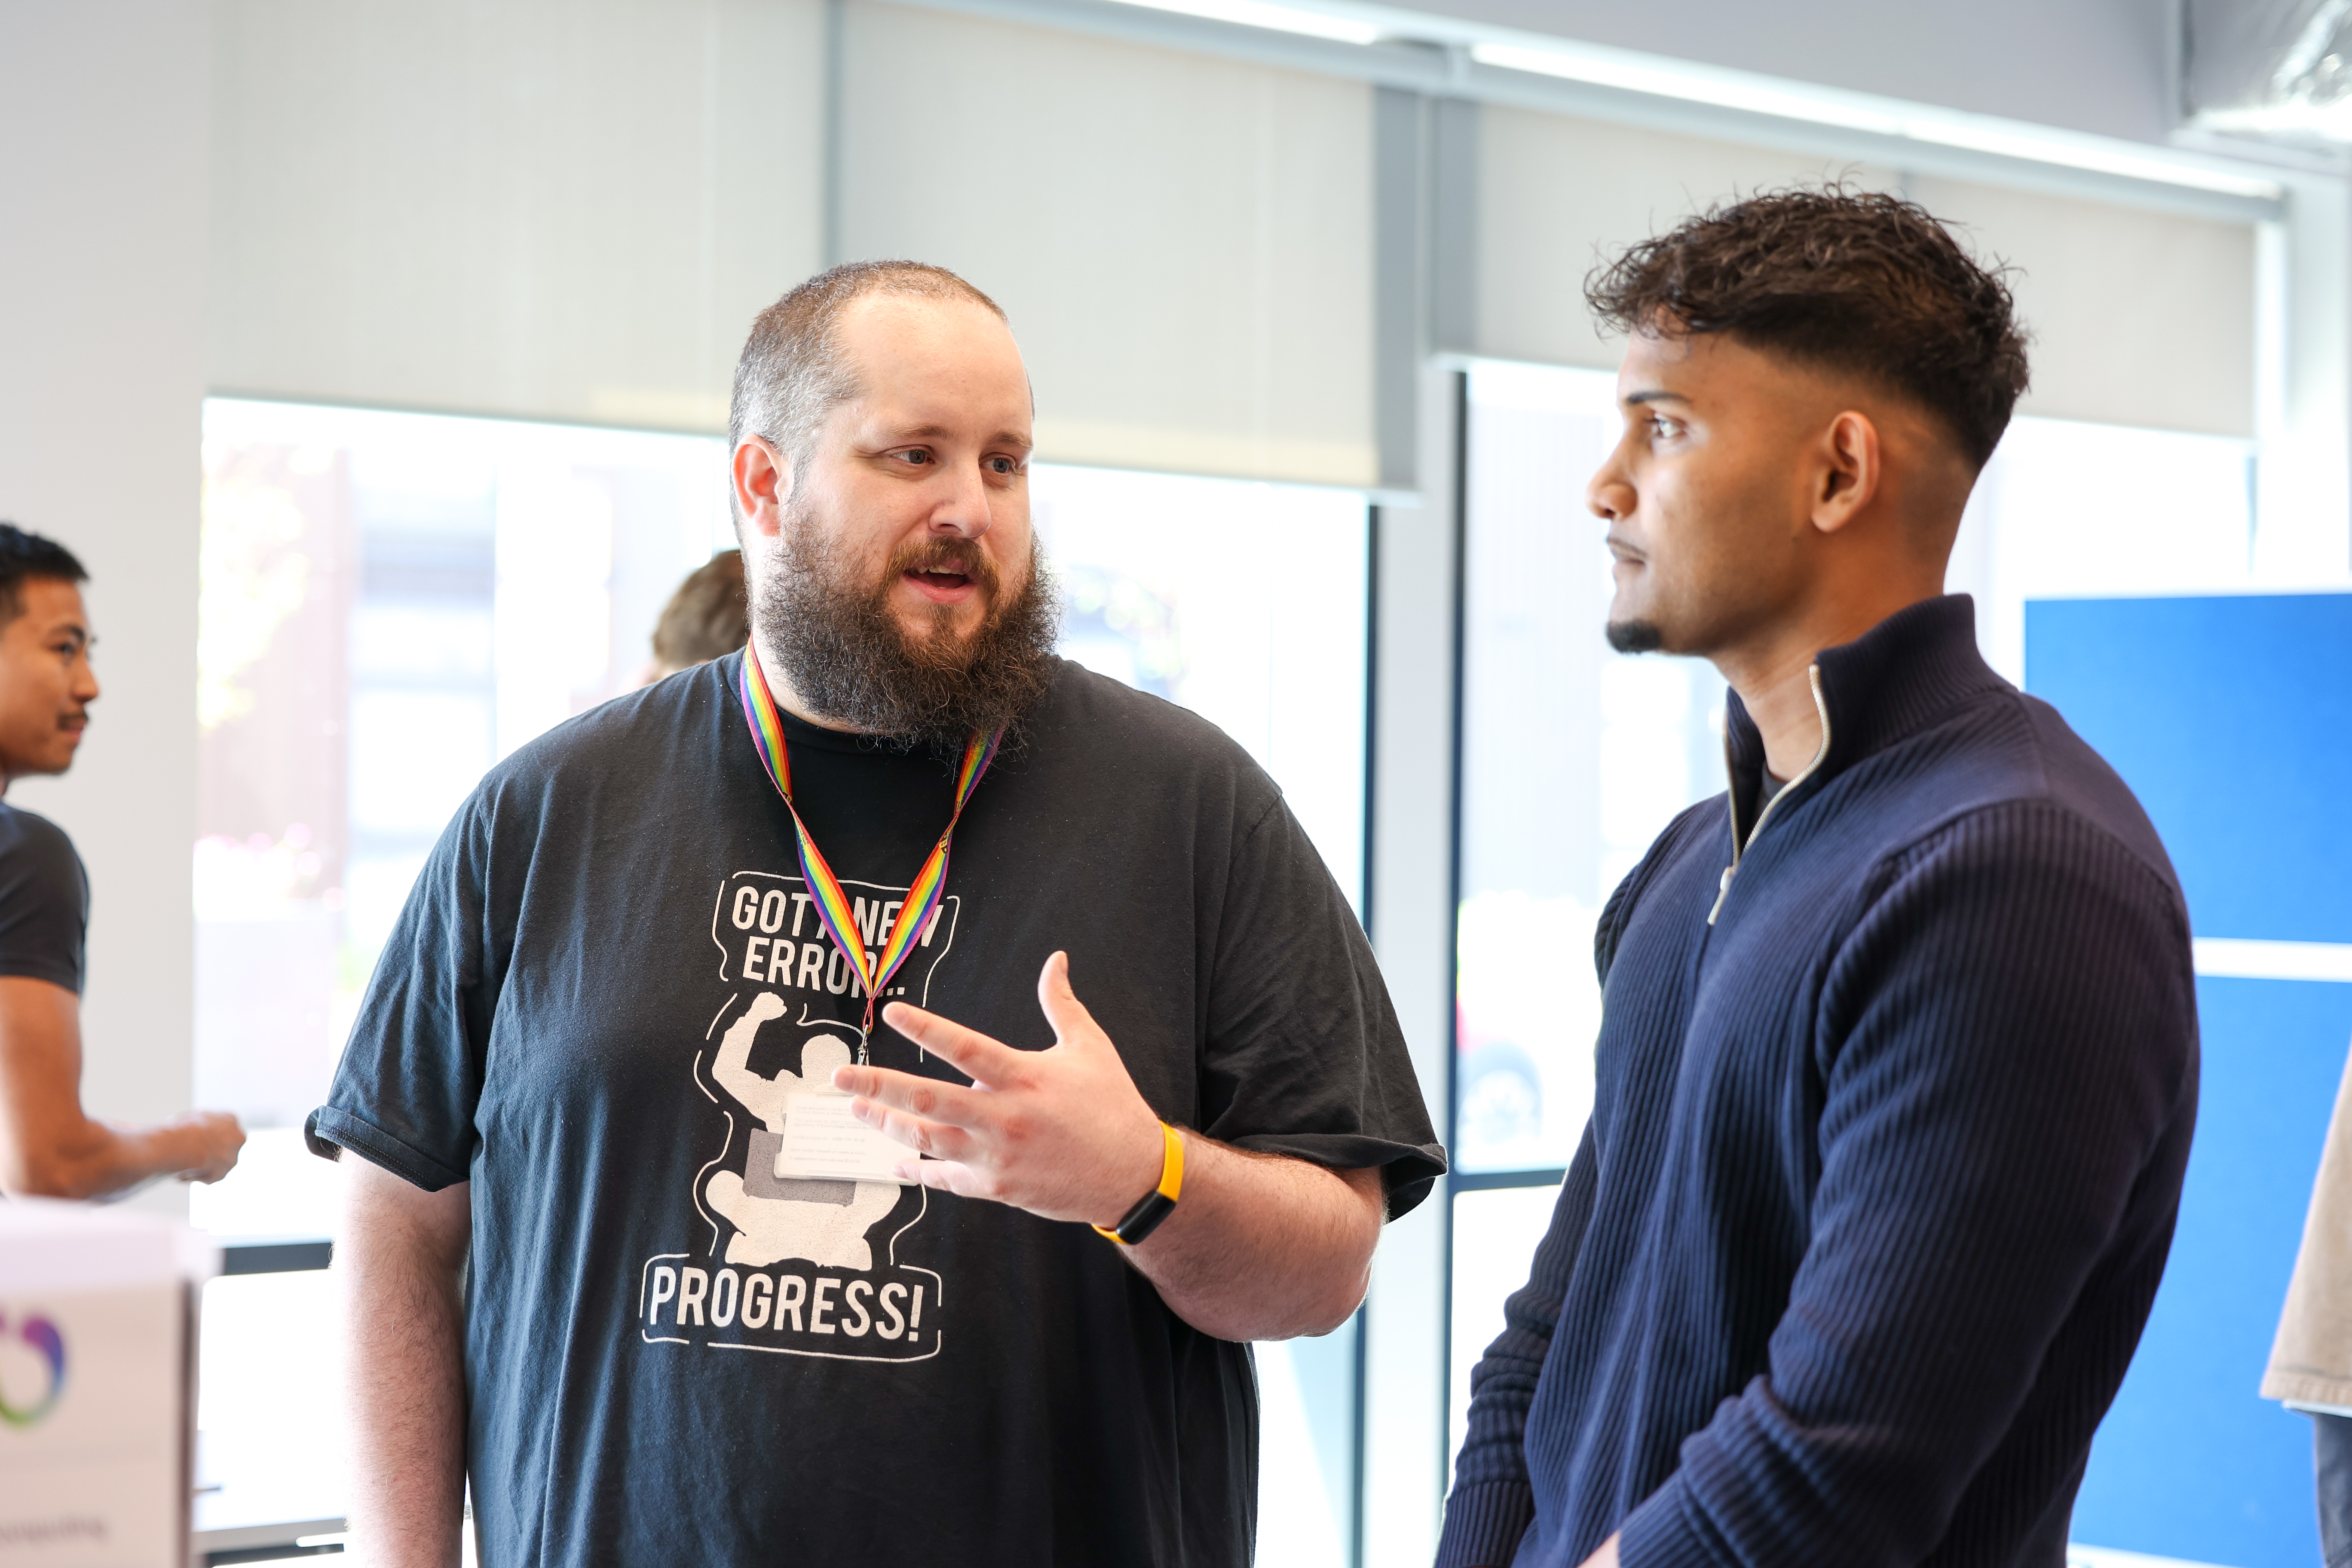
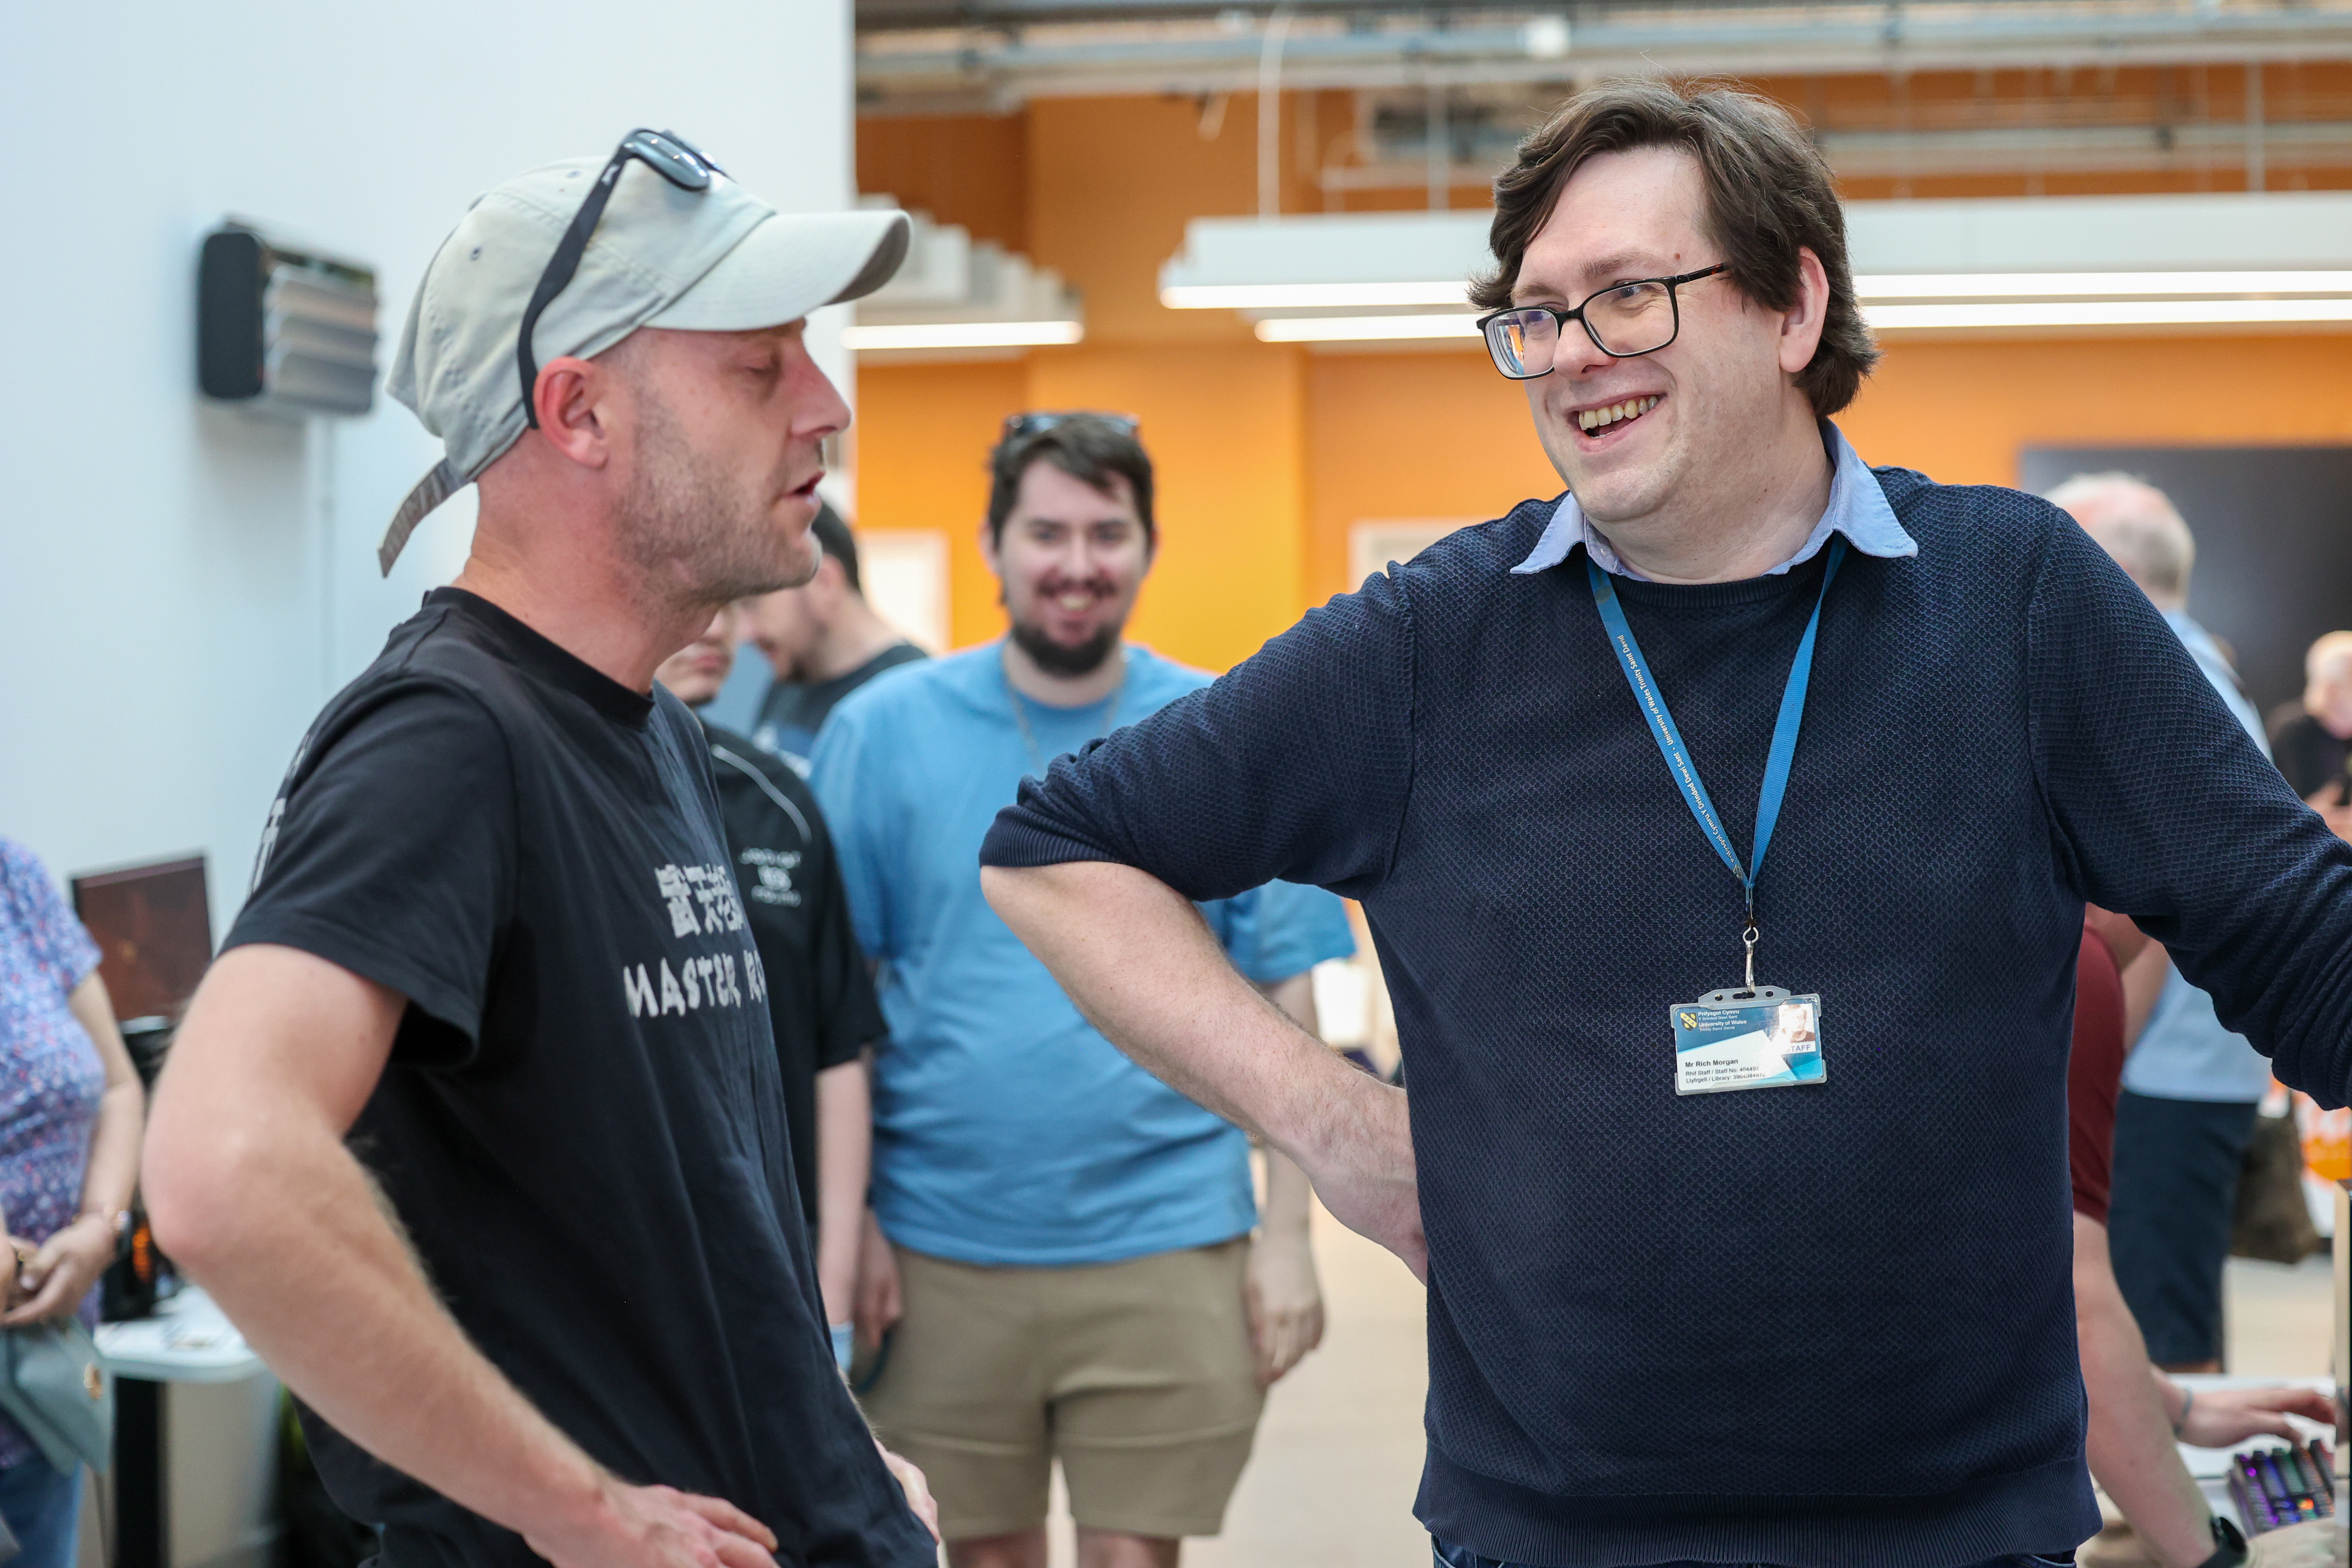
Alongside industry representatives from Fujitsu, who have actively supported the Changemakers Innovation module throughout the year by providing valuable industry insights and expertise included David Jones (Principal Consultant) – pictured below alongside UWTSD Senior Lecturer James Williams. Geraint Williams (Director of Mission Control at Fujitsu) has also been invaluable in supporting UWTSD students in the module this year.
Inspiring Industry Insights from Google and Superdry
The visit featured engaging talks from Neil Rutherfoord (Google Cloud Architect) and Dafydd Moore (CIO at Superdry) who shared their professional journeys, experiences and insights into the rapidly evolving technology sector.
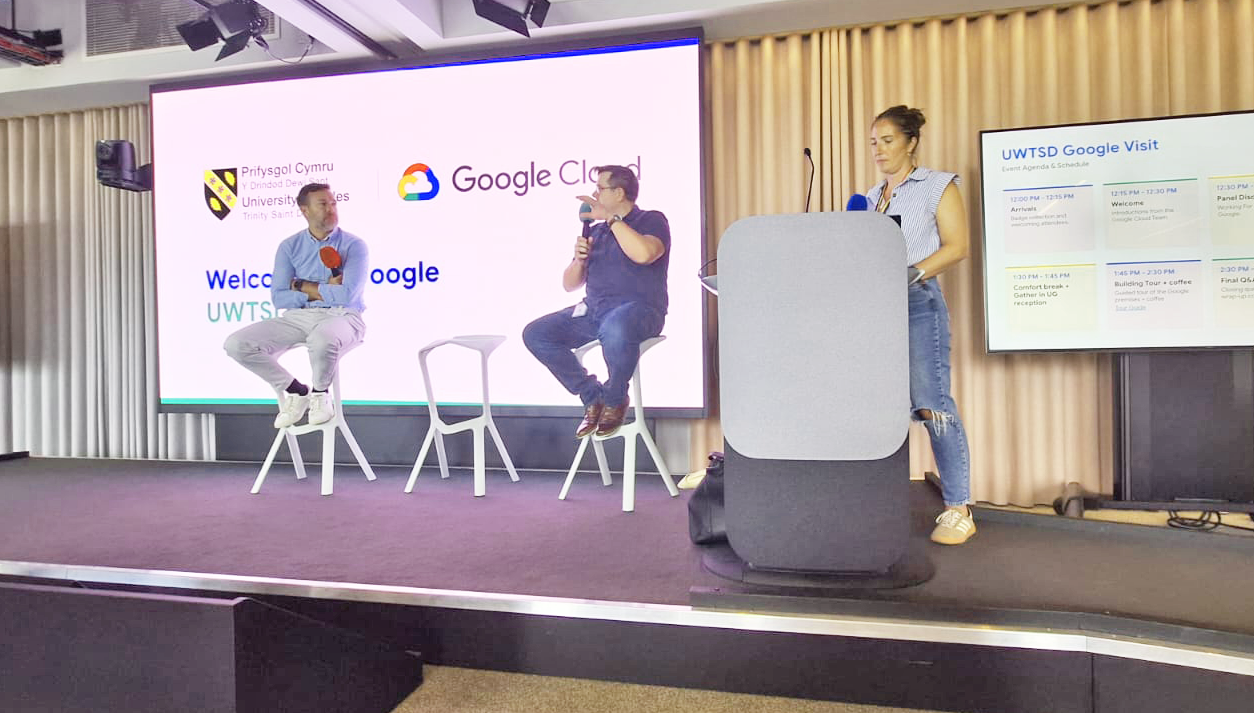
A particularly inspiring moment came from Dafydd, who graduated from the School of Applied Computing approximately 25 years ago. Reflecting on his time at UWTSD, he praised the University’s strong focus on industry-relevant applied learning, highlighting how it provided an excellent foundation for his successful career as a Business and Technology Transformation Leader. And encouraged the students and Graduates to recognise and value their education.
During his career, Dafydd has worked at senior executive levels within internationally recognised organisations, including Dyson and Superdry, while also partnering with the world’s largest and most innovative technology companies such as Google.
Both speakers provided students with valuable insights into current technological developments and emerging trends, with a particular focus on Artificial Intelligence (AI) and the opportunities it is creating across industries.
One of the key messages shared throughout the day was that technology continues to be a powerful force for good. While AI will undoubtedly bring disruption to some aspects of society and employment, it is also helping people and organisations enhance productivity, accelerate innovation and create new opportunities. Students were encouraged to view technological change as an opportunity and to position themselves to thrive within an increasingly digital future.
Preparing Students for Successful Careers
In addition to discussing technology and industry developments, Neil and Dafydd shared practical advice on how graduates can successfully begin and develop their careers. A recurring theme was that while technical knowledge and digital skills remain important, employers increasingly value strong communication, collaboration, adaptability, problem-solving ability and a positive mindset. Students were encouraged to continually learn, remain curious, build professional networks, embrace opportunities throughout their careers and to back themselves.
Reflecting on the attitudes and behaviours that have helped shape their successful careers, Dafydd and Neil shared a simple but powerful message with students:
“Nobody knows everything. Everyone is doing the best they can, and everyone makes mistakes. Stay positive, work collaboratively with others to solve problems, and focus on solutions rather than blame.
Be yourself. Be honest, authentic and care about the people around you. When you build trust and genuinely support others, people will always be more willing to work with you, help you and support you when you need it most.
When you get stuck, take a break, ask for help, and come back to the problem with a fresh, clear mind. Very often, that’s when the solution reveals itself.”
The message resonated strongly with students, reinforcing the importance of resilience, collaboration, authenticity and continuous learning. While technical knowledge and digital skills remain important, Dafydd and Neil highlighted that qualities such as integrity, empathy, communication and a positive mindset are often what distinguish great people, professionals and leaders. Their advice offered students not only practical guidance for building successful careers, but also a valuable framework for navigating challenges and opportunities throughout life.
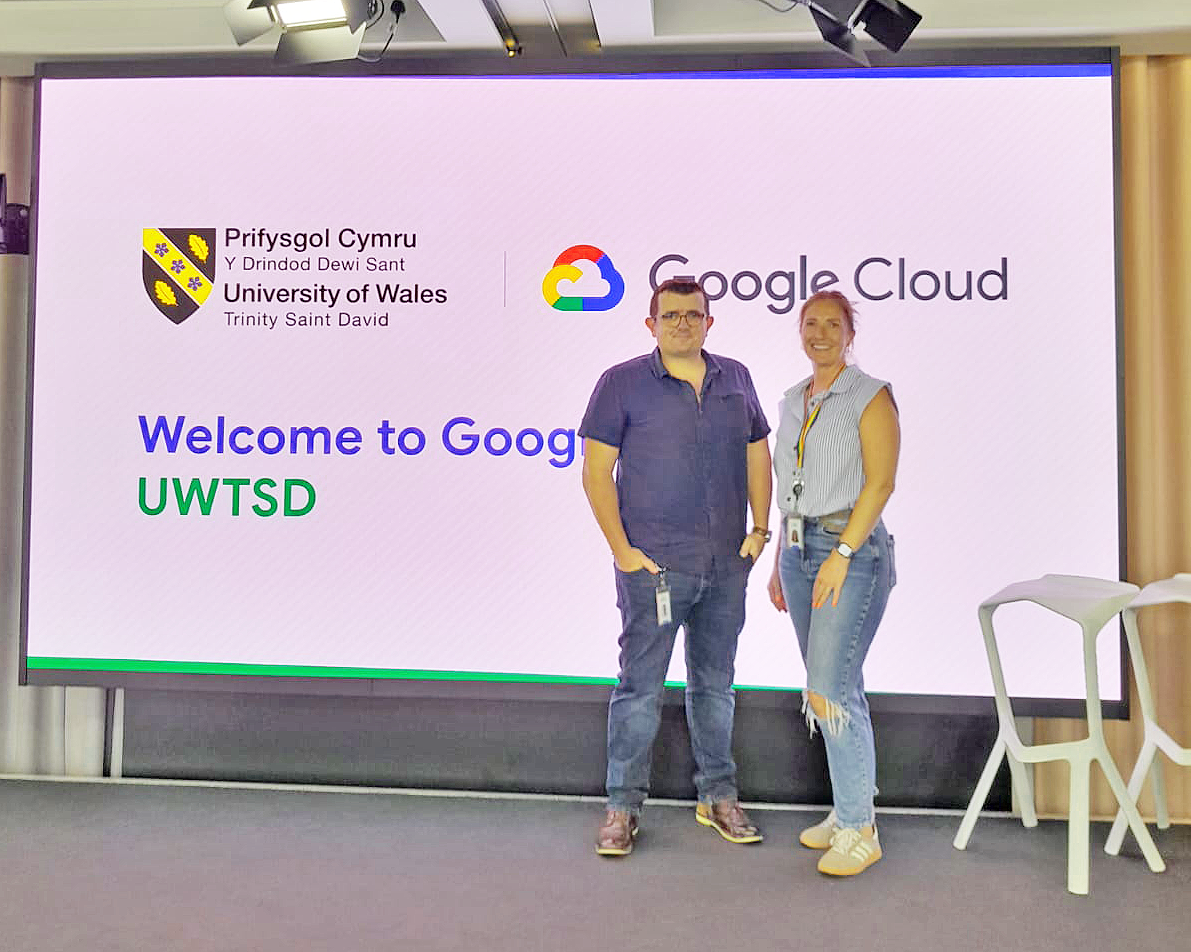
Throughout the presentations, students and staff had the opportunity to ask questions and engage directly with the speakers. The discussions were expertly facilitated by Leah Shergold, who also shared her own experiences, expertise and practical advice regarding careers, technology and the evolving digital landscape.
Behind the Scenes at Google
The visit provided insights into Google’s operations at the Google campus in London, including information about activities taking place within Google’s existing offices at Pancras Square and the Platform 37 development.
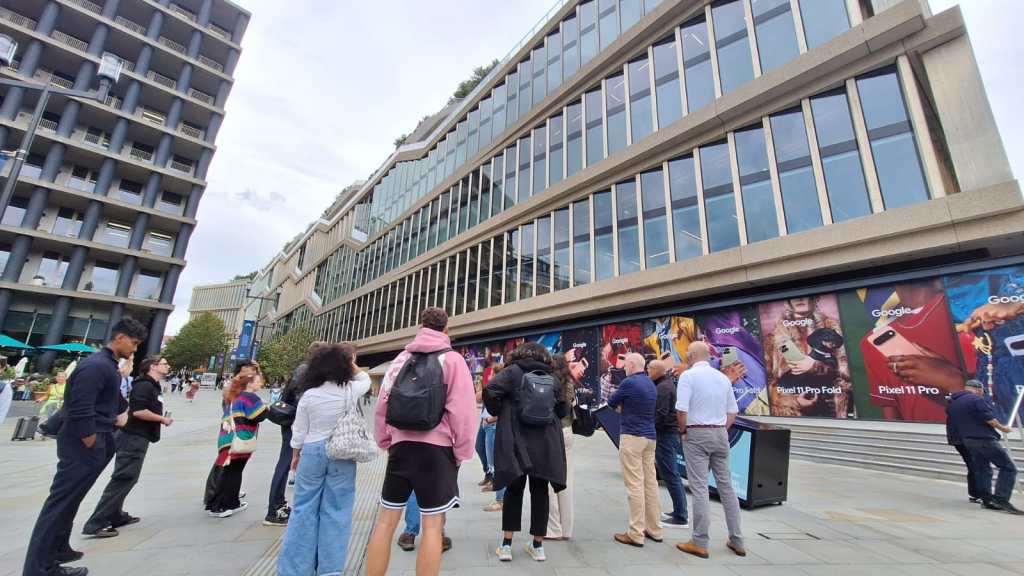

Following the presentations and Q&A session, students and staff were given a guided tour of Google’s impressive facilities at King’s Cross. The tour provided a fascinating insight into Google’s workplace culture and innovative working environment. Attendees explored various collaborative spaces, learned more about how Google’s teams work, and enjoyed views from the building’s impressive rooftop terrace. The group also had the opportunity to visit the Google café and experience first-hand one of the world’s most innovative technology workplaces.
On Our way to Google: Seeing the Future of AI today
Adding to what was already shaping up to be an inspiring day, students and staff experienced an unexpected and fitting moment on their journey into London when they spotted a WAYMO fully autonomous taxi car operating on the streets. As one of the world’s most advanced examples of real-world Artificial Intelligence and autonomous driving technology, it provided a tangible glimpse into the future that many of the day’s discussions would later explore.

The sighting felt particularly serendipitous. Here was a group of UWTSD’s most creative, innovative and successful Computing students, travelling to one of the world’s leading technology companies to celebrate their achievements, while witnessing first-hand a cutting-edge AI innovation that only a few years ago would have seemed like science fiction. The moment served as a powerful reminder of how rapidly technology is evolving and how today’s students have the opportunity to contribute to shaping the innovations of tomorrow.
Celebrating Student Achievement
The visit represented more than simply a reward for academic success. It demonstrated the strong links UWTSD continues to build with leading industry organisations and highlighted the University’s commitment to providing students with meaningful real-world experiences that complement their studies. By connecting students directly with industry leaders, technology experts and successful alumni, UWTSD continues to prepare graduates with the skills, knowledge and confidence needed to succeed in a rapidly changing digital economy.
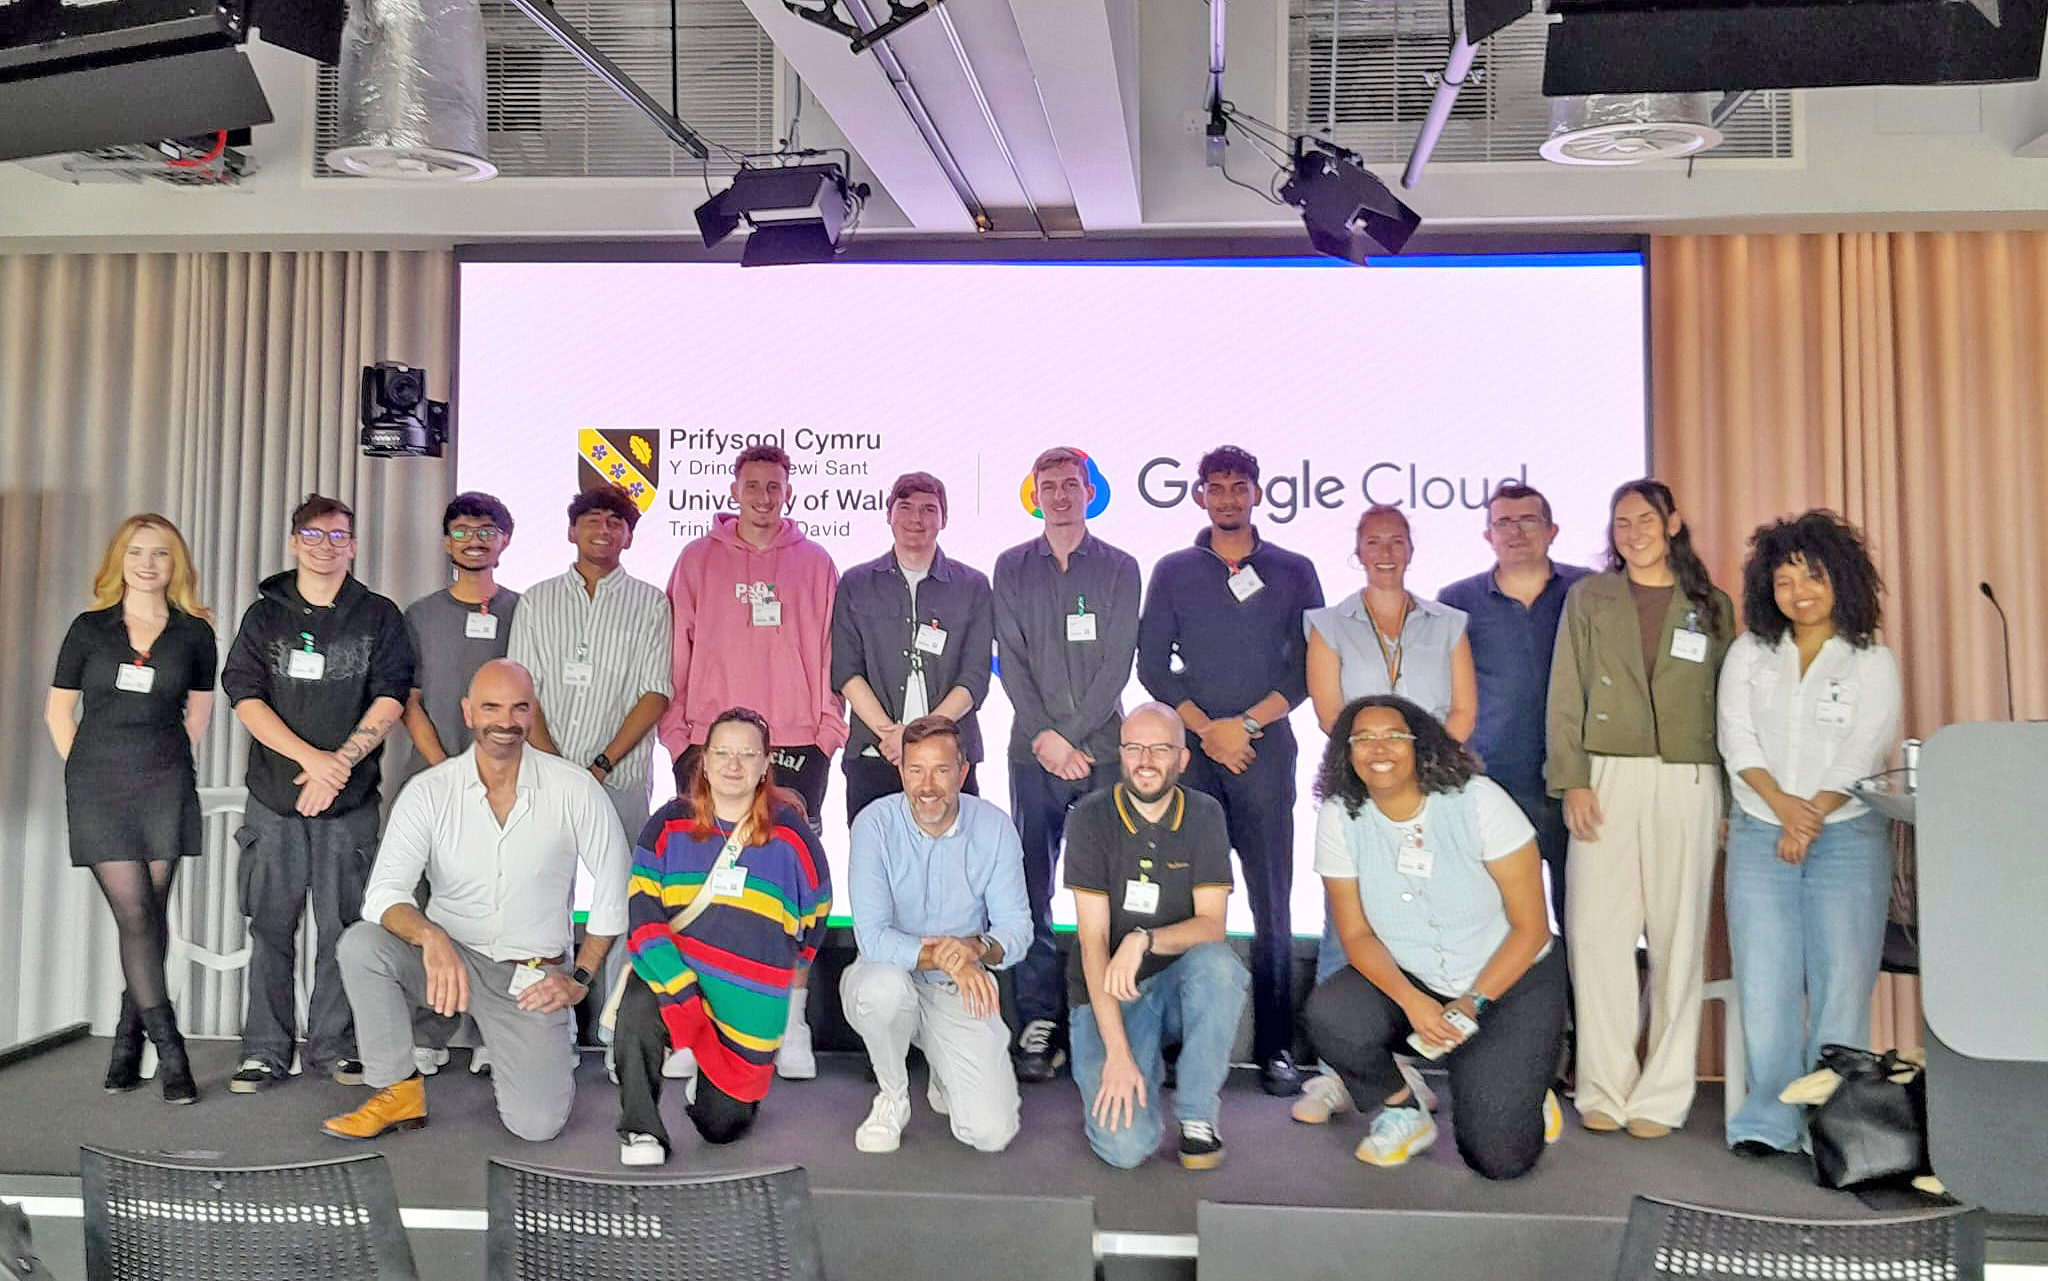
Congratulations to all of our students who earned their place on this memorable visit through their outstanding achievements in the Changemakers Innovation Competition, Emerging Trends Competition, and through producing Award-winning Industry-relevant Final year projects. Their success reflects the creativity, innovation and dedication that continues to thrive within the School of Applied Computing at UWTSD.
We would like to thank Google‘s Leah Shergold & Neil Rutherfoord, Digital Transformation Executive Dafydd Moore and our industry partners at Fujitsu David Jones & Geraint Williams for helping create such an inspiring and valuable experience for our students. And to Gaynor Thomas & Mark Huntly for transporting us in the SOAC FunBus from one side of the country to the other and back 😊 to South Wales’s Silicon Valley. Diolch yn fawr iawn i ti
~






 UWTSD Applied Computing Blog
Written by jameswilliams
Leave a comment