Q. Project title: Detection of fusarium head blight on wheat spikelets using a multi-scale feature fusion CNN model.
Q. Introduction/rationale: The motivation for choosing this project stems from the significant impact of fusarium head blight (FHB) on wheat production, which poses a threat to global food security. By leveraging advanced artificial intelligence techniques, this project aims to develop a robust detection system that can assist farmers in early identification of FHB, ultimately contributing to better crop management and yield optimization.
Q. Overview of the practical implementation:
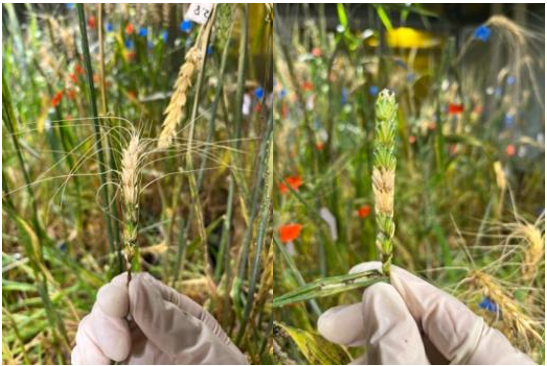
Data Collection: Acquiring a dataset of wheat spikelet images, both healthy and affected by FHB.
Figure 1: Dataset Samples
Model Development: Designing a multi-scale feature fusion convolutional neural network (CNN) to analyze the images. Built on the advanced YOLOv9 framework, the model incorporates a Multi-Scale Feature Enhancement and Fusion (MSFEF) module, which plays a critical role in extracting and dynamically enhancing features from various scales. To enhance computational efficiency, as shown in Figure 2, optimized convolutional layers such as RepNCSPELAN and DWConv are used, reducing the overall computational load while maintaining high detection performance.
Figure 2: Proposed network overview
Training and Testing: The model was trained on the dataset using techniques like data augmentation (Mosaic) to enhance its robustness. Testing was conducted to evaluate accuracy and performance.
Figure 3: Training batch samples
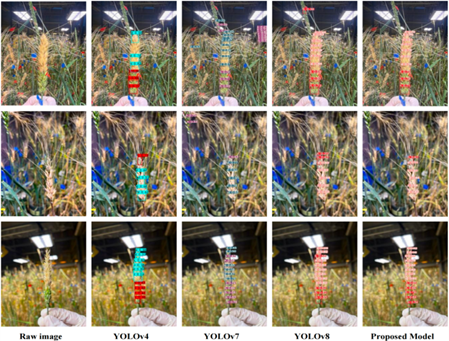
Deployment: The final model can be integrated into a user-friendly application for real-time detection, offering researchers and farmers an efficient tool for early disease detection and management.
Figure 4: Model predictions
Q. Overview of outcome/conclusion:
The project successfully demonstrated that the proposed multi-scale feature fusion CNN model can accurately detect fusarium head blight in wheat spikelets, achieving an accuracy of over 90%, which highlights the potential of AI-driven solutions in agriculture, paving the way for future advancements in plant disease management and crop monitoring.
Q. What Career and job role are you hoping to move into after graduation?
After graduation, I aspire to work as a machine learning engineer, focusing on applying AI in agricultural technology. My goal is to contribute to innovations that enhance food security and sustainability through smart farming practices.
Q. Please share a top tip/advice for students who are interested in completing a University Degree?
One essential piece of advice is to stay curious and actively engage with your coursework beyond the classroom. Seek out projects, internships, and collaborative opportunities that apply your knowledge in real-world contexts. Building a strong network and gaining practical experience will significantly enhance learning and career prospects.
For further information about Computing courses at UWTSD, please click-here.
Student name: Mohammed Talha Sajidhusein Vasanwala
Rationale:What was the reason/motivation for choosing the project?
The volatility of stock markets presents a major challenge in financial forecasting. Traditional methods, while effective in some cases, struggle to capture the inherent complexities of financial data, such as time dependencies, trends, and market shocks. Tesla’s stock prices, which are known for their rapid fluctuations, piqued my interest for this project. The motivation behind choosing this project was twofold:
To explore how Long Short-Term Memory (LSTM) networks can be optimized to capture and predict the volatile patterns in stock price data.
To address the limitations of traditional models and highlight the potential of LSTM models for accurate financial forecasting, especially in dynamic environments like stock trading.
Q. Brief Overview of the Practical Implementation (Text Description and a Few Images)
The practical implementation of this project involved multiple stages, including data preprocessing, building and testing LSTM models, and evaluating the models’ predictive performance. Here’s a breakdown of the key steps:
Data Preprocessing:
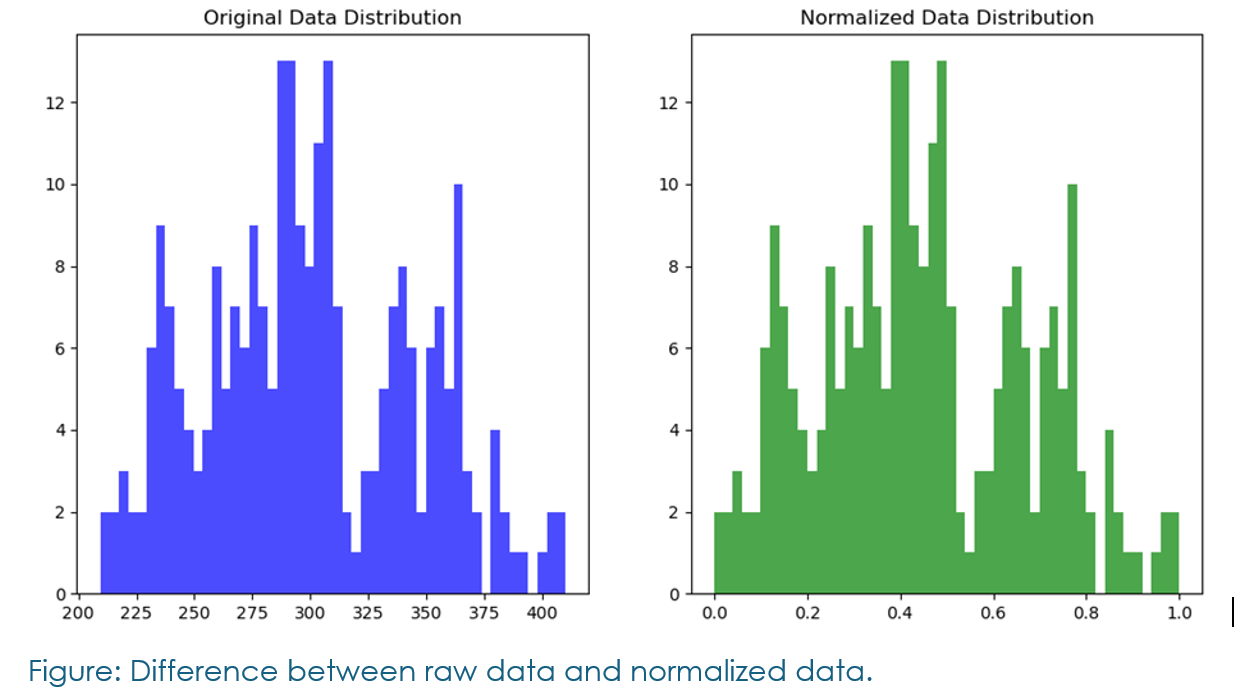
Tesla’s historical stock data (specifically ‘Close’ prices) was collected and cleaned.
The data was normalized using MinMaxScaler, which is crucial for speeding up the LSTM training process.
The dataset was then split into training and testing sets, ensuring proper chronological order for the time-series data.
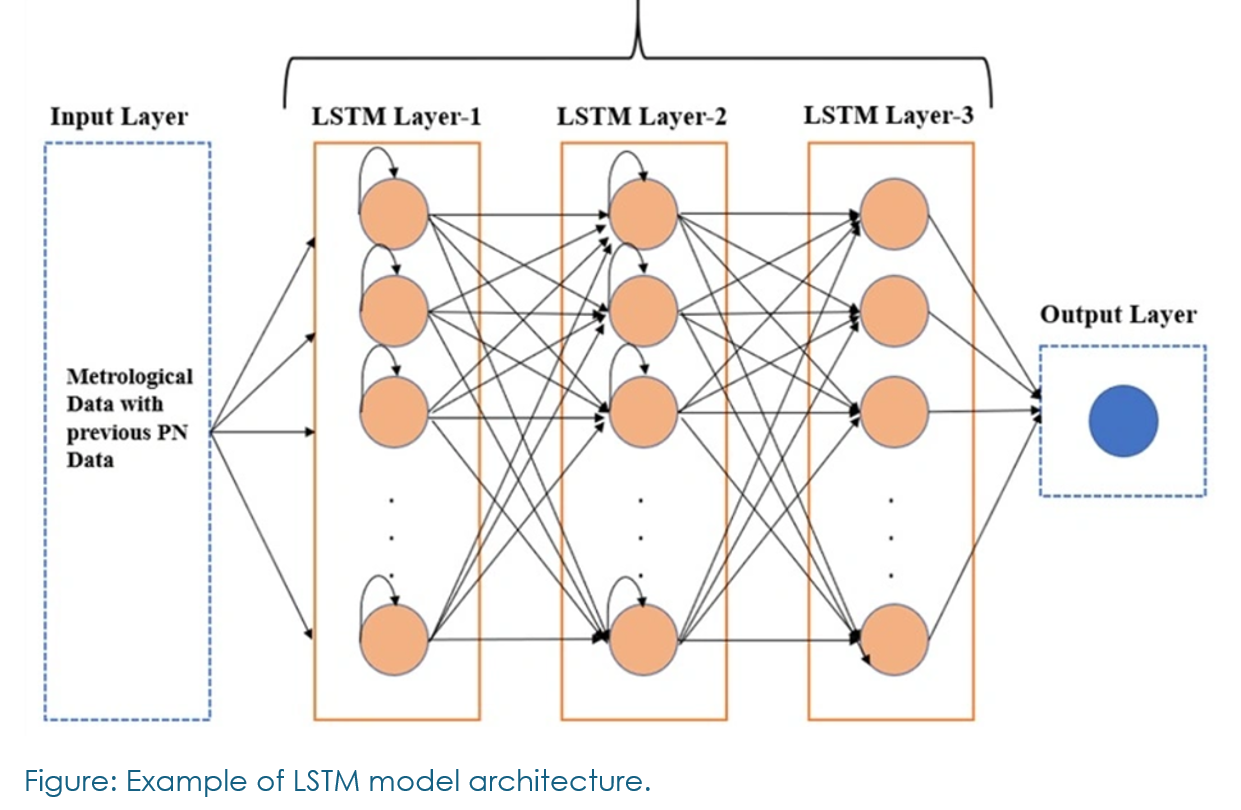
Model Building:
Thirty different LSTM configurations were tested, focusing on adjusting layers, units, activation functions, and learning rates.
The final best-performing model consisted of three LSTM layers, each with 64 units and ‘tanh’ activation functions. The model also used the ReduceLROnPlateau and EarlyStopping callbacks to optimize training and prevent overfitting.
Training and Evaluation:
The models were trained with RMSE, MAE, MSE, and R² score as key evaluation metrics.
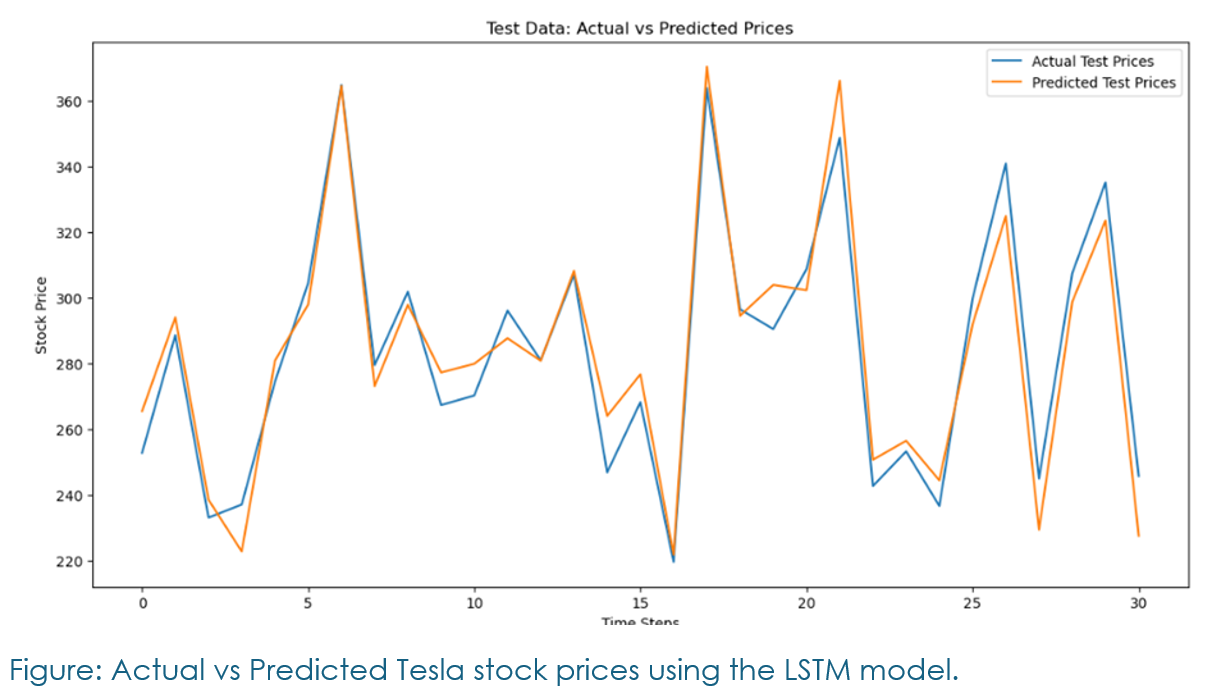
The best model achieved an RMSE of 0.0456 and an R² score of 0.944, demonstrating its high accuracy.
Q. Overview of Outcomes/Conclusions
The project successfully developed an optimized LSTM model that significantly outperformed traditional forecasting methods. The model was able to capture the temporal dependencies in Tesla’s stock price data and deliver highly accurate predictions. Some key outcomes include:
High predictive accuracy: The final model achieved a strong RMSE of 0.0456 and an R² score of 0.944, reflecting its superior performance in predicting Tesla’s stock prices.
Overcoming common challenges: Issues such as overfitting were effectively addressed using advanced regularization techniques and dynamic learning rate adjustments.
Despite the success, the study recognized the limitation of relying solely on historical data. Incorporating real-time data such as news sentiment and company-specific updates could further improve the model’s performance in capturing sudden market changes.
Q. Top Tips/Advice for Students Interested in completing a University BSc/MScDegree:
Start Early: Begin your project as soon as possible, especially right after submitting your research proposal. This will give you ample time to explore different ideas, refine your methods, and address unexpected challenges along the way.
Be Proactive in Securing Data: Data accessibility can sometimes be a bottleneck. Make sure you identify and secure the necessary datasets early in your project, even if they require permissions or payments.
Iterate and Experiment: Machine learning projects, especially those involving deep learning models like LSTMs, benefit greatly from iterative experimentation. Small changes in hyperparameters can have a significant impact on model performance, so don’t hesitate to test various configurations.
Understand your Tools: Take time to thoroughly understand the libraries and tools you’re using. In my case, libraries like Keras and TensorFlow were vital for building LSTM models. Understanding how to efficiently use these tools sped up my development process.
Consult your Supervisor Regularly: Keep in close contact with your supervisor. Their feedback is invaluable, especially when it comes to refining your methodology and solving challenges related to your project. Stay Resilient: Research can be unpredictable. You might face challenges like overfitting, lack of data, or even model failure. The key is persistence and a willingness to adjust your approach as needed.
For further information about Computing courses at UWTSD, please click-here.
Project title: A Comparative Evaluation of Machine Learning Techniques for Sales Forecasting
/\ Sriskantharaja Mithushan
Rationale:What was the reason/motivation for choosing the project?
The motivation behind choosing this project stemmed from the increasing importance of accurate sales forecasting in business decision-making. Companies rely heavily on predictive models to optimize inventory management, plan marketing strategies, and drive revenue growth. I was particularly interested in how different machine learning techniques could enhance the accuracy of these predictions, compared to traditional forecasting methods. My goal was to explore and compare the effectiveness of various machine learning models in improving sales forecasts, which could have a significant impact on business operations and profitability.
Machine learning (ML) is a branch of artificial intelligence (AI) and computer science that focuses on using data and algorithms to enable machines to learn from experience, much like humans do. In analyzing data, the ML algorithm, processes data multiple times to learn / adjust itself to improve accuracy.
Q. Brief overview of the practical implementation?
The project was conducted in several stages, starting with data gathering, followed by preprocessing, model execution, and evaluation. A rich dataset was collected from various retail and e-commerce platforms, containing sales records, customer demographics, product categories, and revenue figures. This data was cleaned and transformed to handle missing values, normalize scales, and ensure proper formatting for model training.
Five machine learning models were implemented:
Random Forest
Support Vector Regression (SVR)
LightGBM
XGBoost
Gated Recurrent Unit (GRU) Neural Network
Each model was trained on the prepared dataset using Python, with libraries such as Scikit-learn, LightGBM, XGBoost, and TensorFlow.
After training, predictions from each model were compared to the actual sales data. Visualization tools like Matplotlib and Seaborn were used to graphically depict the performance of each model, with side-by-side comparisons of RMSE and MAPE metrics. These visualizations helped to highlight the strengths and weaknesses of the various models.
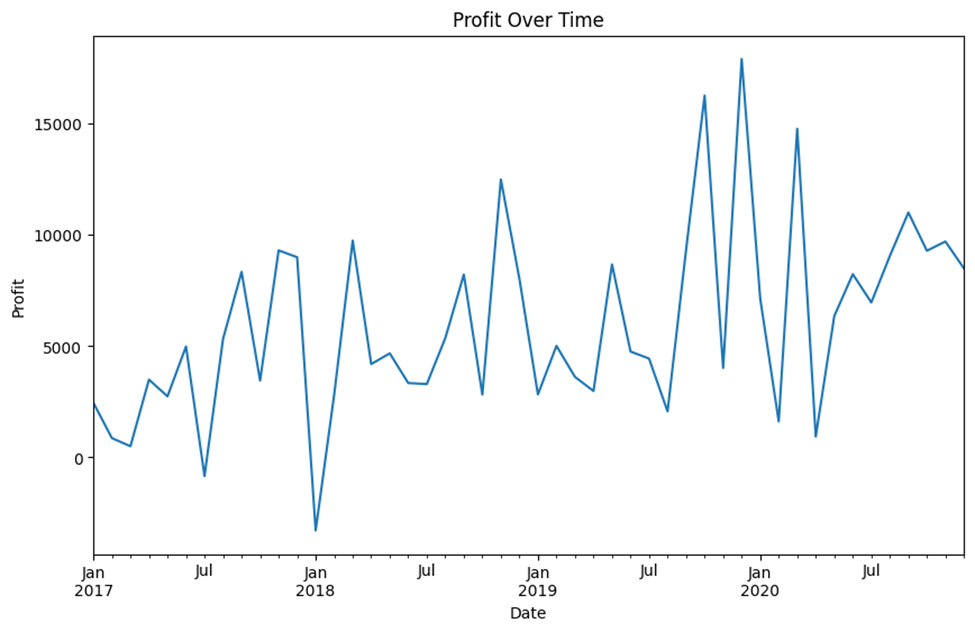
The Profit Over Time graph below, tracks monthly profit trends, providing a clear view of how profitability fluctuates over time. Key insights include: Seasonality and Profit Growth or Decline. For example Seasonality highlights periods of increased or decreased profits, often aligned with sales cycles or specific marketing efforts. This helps in identifying high-profit months and adjusting strategies for low-profit periods.
This visualization is crucial for understanding financial performance, aiding in strategic decision-making, and optimizing resource allocation for long-term profitability.
/\ Profit Over Time: Illustrates monthly profit trends.
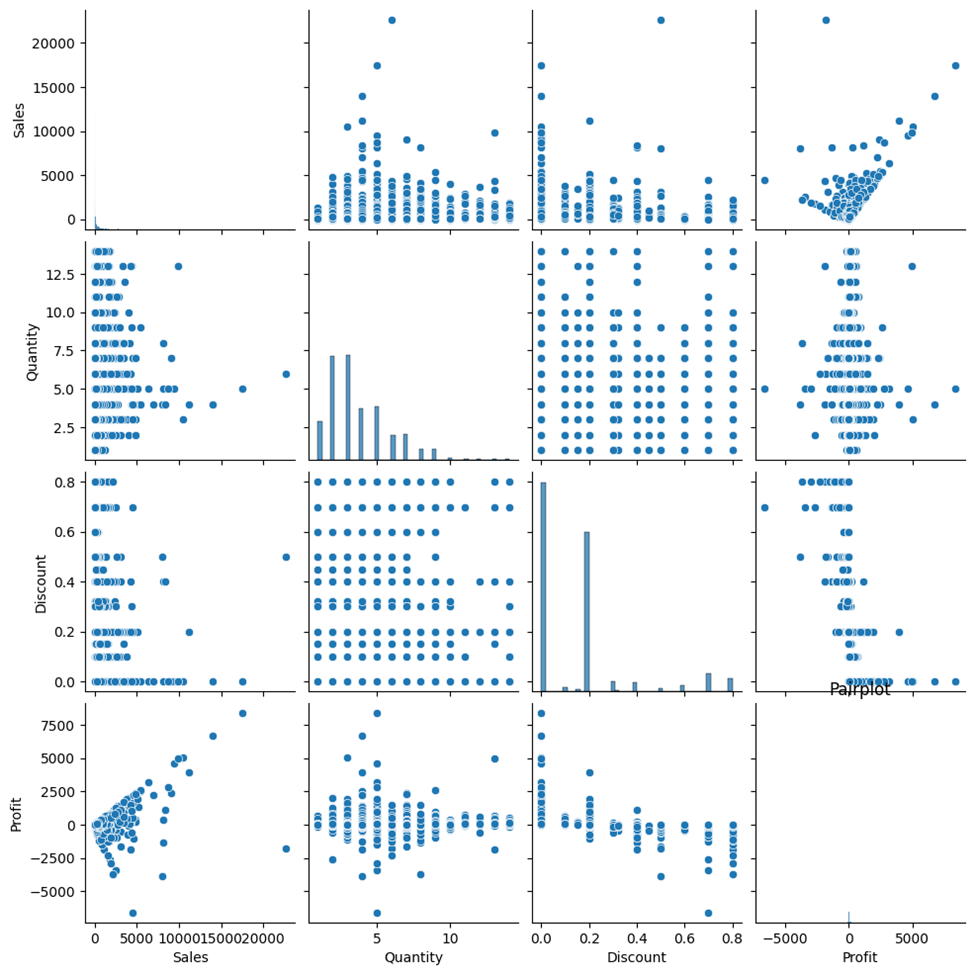
This pairplot chart below, simultaneously shows the distributions (diagonal plots) and relationships (scatter plots) between the key variables: Sales, Quantity, Discount, and Profit. For example the scatter shows a strong positive relationship, confirming that higher sales lead to greater profits. A weak negative trend suggests that offering larger discounts may slightly lower profits. This pair plot provides a comprehensive overview of how these variables relate to each other and how each is distributed, helping in identifying trends, correlations, and potential outliers.
/\ Pairplot: Distributions and Relationships Between Sales, Quantity, Discount, and Profit.
The chart below is a Heat-map. The Heatmap shows the correlations between the key business metrics of Sales, Quantity, Discount, and Profit. The color intensity represents the strength and direction of the relationships, with darker colors indicating stronger correlations. For example, a deep hue between Sales and Profit highlights that as sales increase, profits rise significantly. This visual tool helps identify how these variables interact and guide strategic decisions on pricing, sales, and profit optimization.
/\ Correlation Matrix Heatmap: Sales, Quantity, Discount, and Profit
Q. Overview of outcomes/conclusions?
The project concluded with Random Forest emerging as the top-performing model in terms of prediction accuracy.
The research delved into the use of machine learning techniques for sales forecasting in the retail and e-commerce sectors, with the goal of identifying which models provide the most accurate predictions. The study examined five machine learning algorithms: Random Forest, Support Vector Regression (SVR), LightGBM, XGBoost, and Gated Recurrent Unit (GRU) neural networks. The models were evaluated using metrics such as Root Mean Square Error (RMSE) and Mean Absolute Percentage Error (MAPE).
This study contributes to the understanding of how machine learning can be applied to sales forecasting in retail and e-commerce. It shows that tree-based ensemble methods, particularly Random Forest, are among the most effective techniques. However, deep learning models like GRU also show potential, particularly for capturing temporal dependencies. A balanced approach, combining multiple models and fine-tuning hyperparameters, can lead to more accurate sales predictions. By acting on these insights, retail and e-commerce companies can improve their forecasting accuracy, optimize inventory management, and ultimately enhance customer satisfaction and profitability.
Q. Please share some top tips/advice for students?
Completing a Bachelor of Science (BSc) or a Master of Science (MSc) at a university like the University of Wales Trinity Saint David (UWTSD) can be a rewarding and challenging journey.
The University offers a variety of Computing courses. Ensure you choose a program that aligns with your interests and career goals. During both BSc and MSc, you’ll often have the flexibility to choose elective modules. Select modules that allow you to develop key skills that are in-demand in your field, or that attract your personal interest. Balancing lectures, labs, independent study, and personal commitments is crucial. Use digital tools to organize deadlines, assignment dates, and exam preparation to stay on track. The University also offer career services to help students prepare for employment. Take advantage of these CV workshops, interview practice, and employability training.
For further information about Computing courses at UWTSD, please click-here.